Getting Started with the Decision Tree Software
Welcome to the world of normative decision theories. SpiceLogic Decision Tree software (also a Decision Tree Maker) is a highly featured advanced decision analysis tool that lets you model a decision tree with an advanced sophisticated utility function, either single or multiple criteria, Cost-Effectiveness analysis, especially for healthcare systems or any regular business decision. It lets you build a Markov Decision Process with Cohort simulation. You can perform Monte Carlo Simulation, Risk Analysis, and lots of exciting stuff. But, there is a point from where you need to get started. And this is that getting started page. On this page, we will not talk about the details of every feature, as we have dedicated pages for explaining all the features separately as you can see from the left documentation navigation menu. Rather, on this page, we will do some fun. We will create a decision tree with payoffs and perform a simple Expected Value-based analysis. And honestly, that may be the most useful case of this software. So, let's do that.
I will give a medical decision example, but please do not assume that this software is mainly for medical. No, this software is used by lots of businesses where business decisions are made. Normative decision theories are the same for all fields. But, we found that there are lots of healthcare students using this software for medical decision-making, so why not demonstrate an example from a healthcare application?
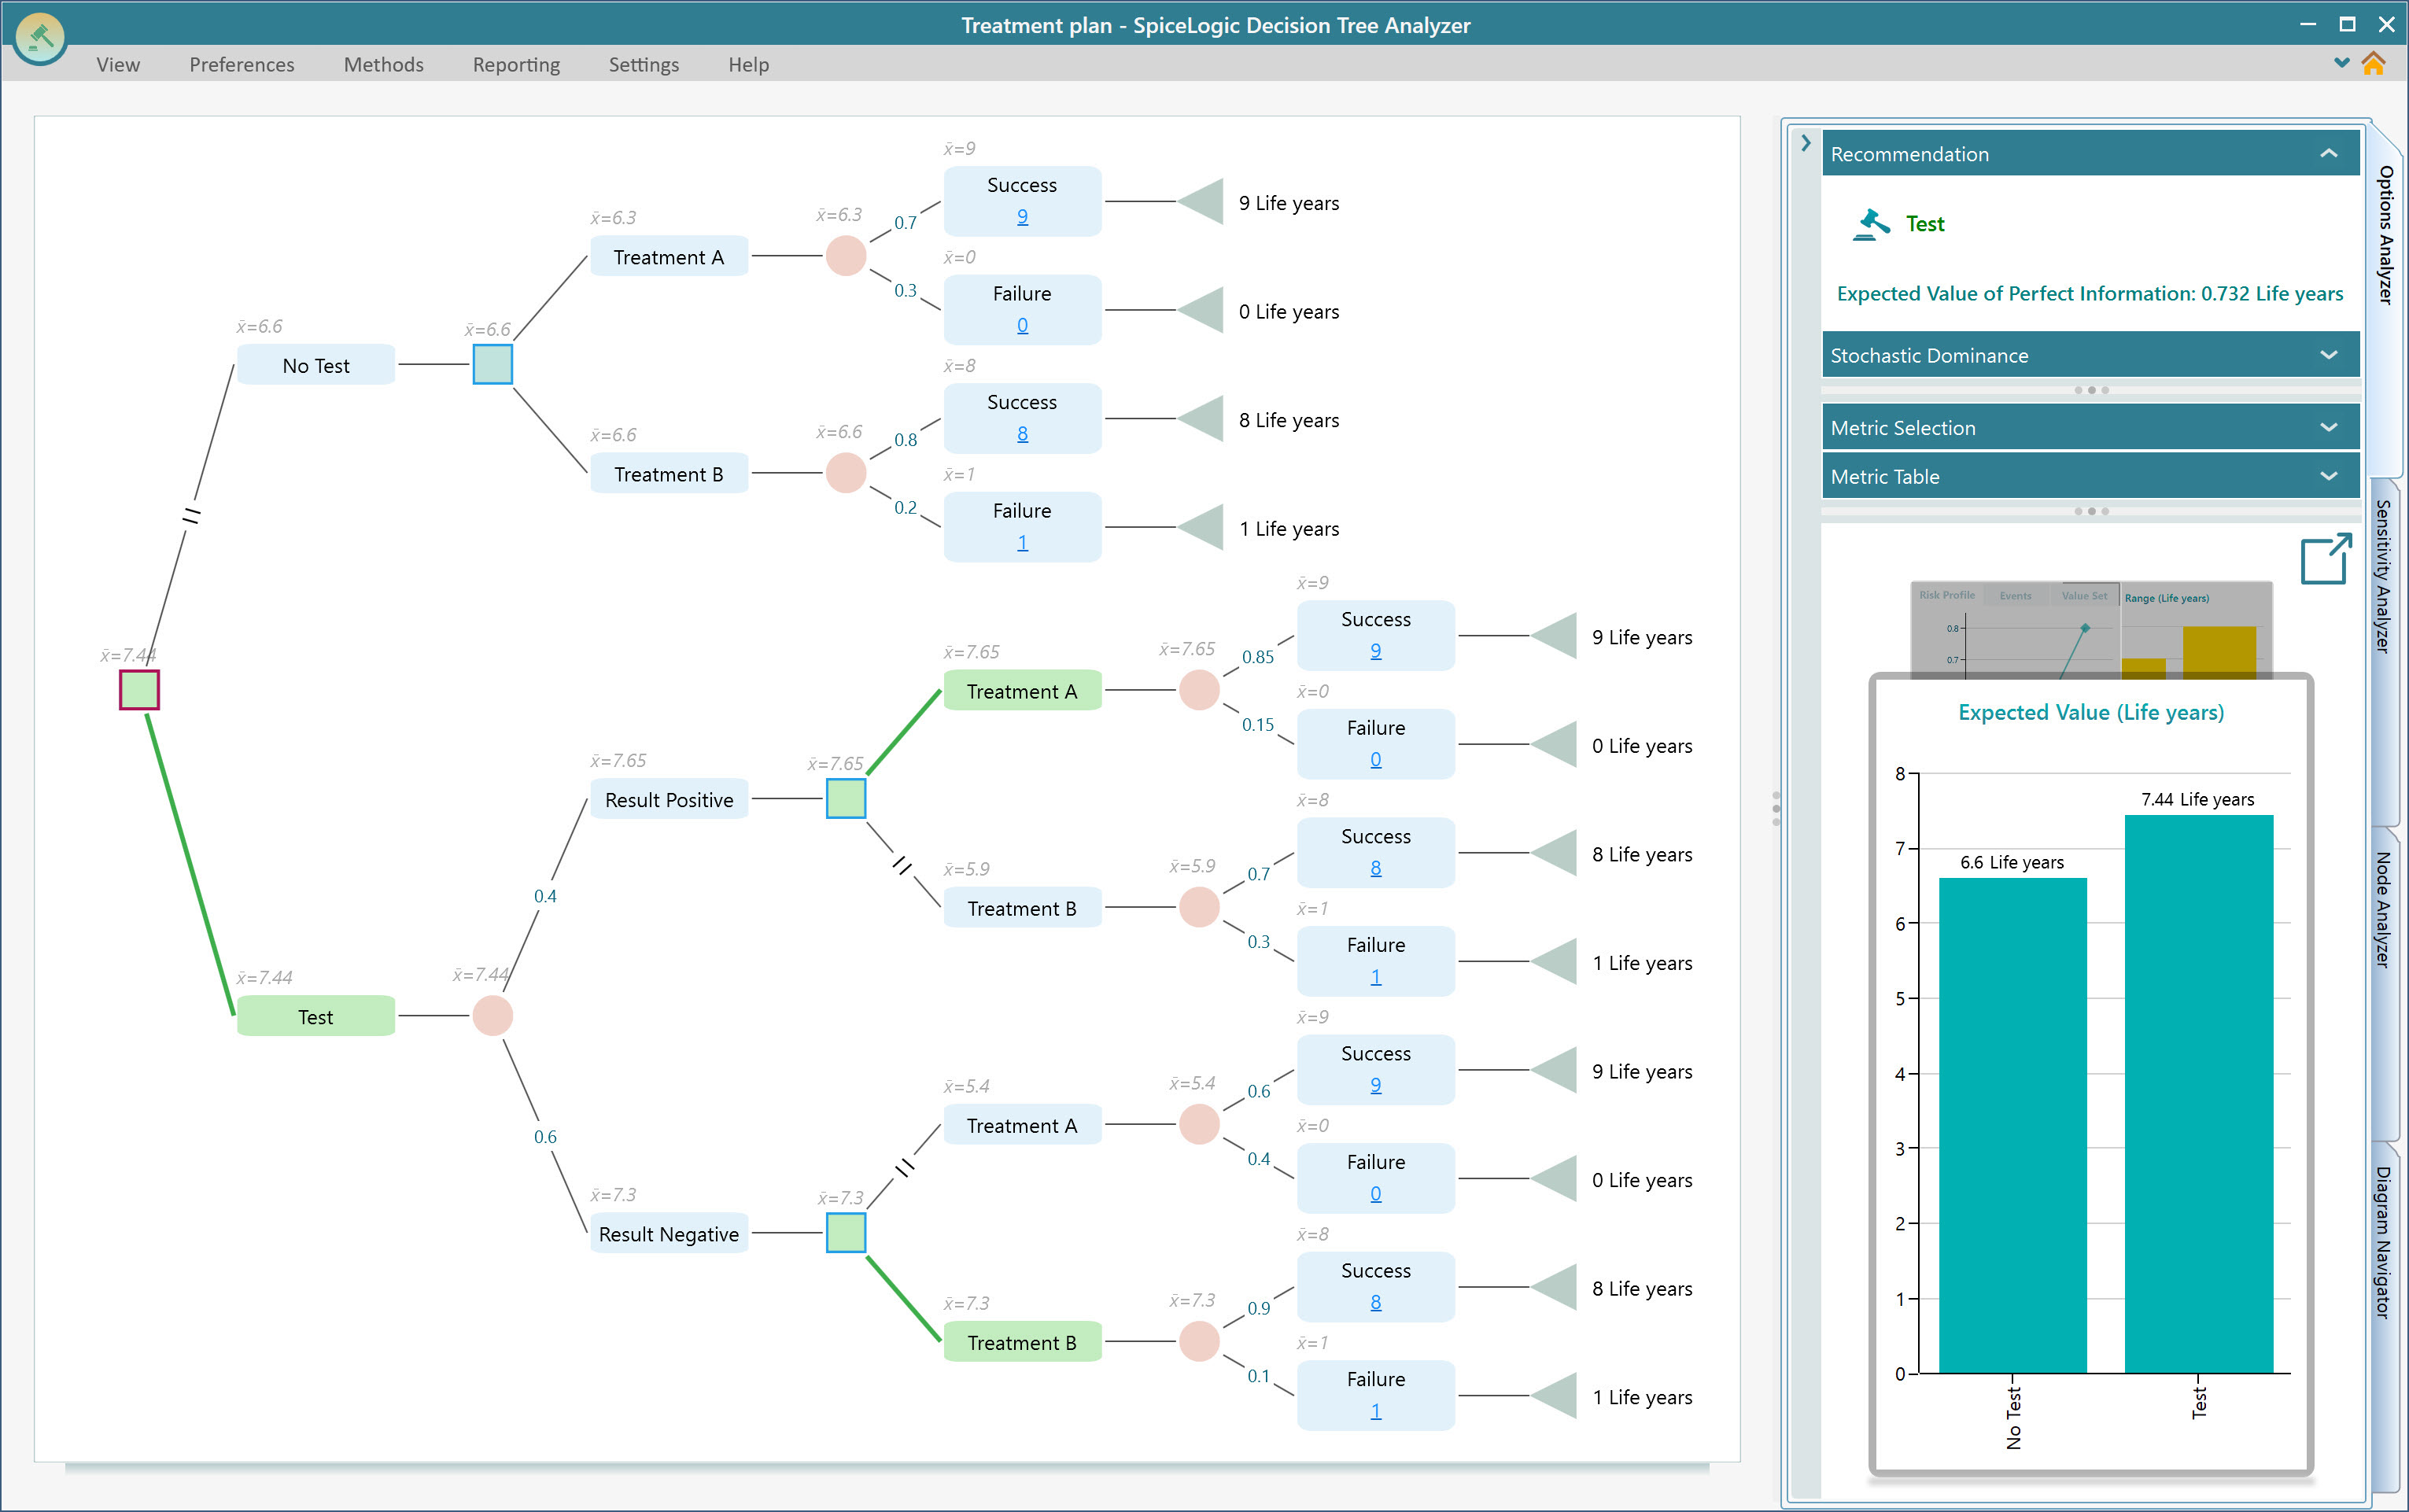
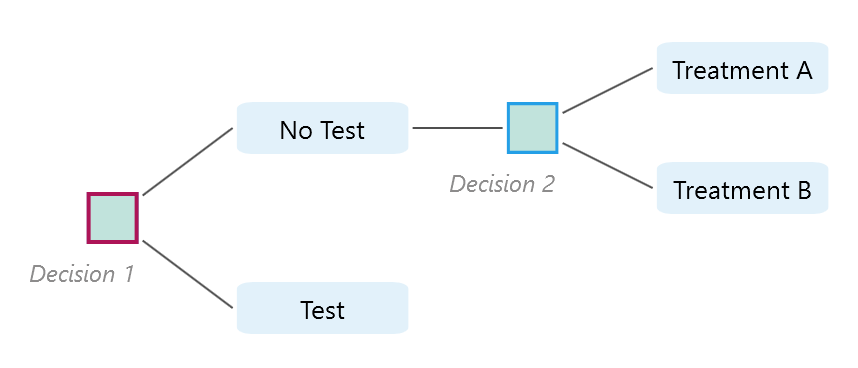
Say, you want to model a medical decision where you have two options, "Do a test" and "No test". If you do a test, you can get positive results and negative results. Either way, you have two options, "Treatment A" and "Treatment B". Every treatment has two possibilities, "Success" and "Failure". And based on Success and Failure, you can expect a Life year for your patient. Now, using a decision tree, you want to perform an expected value analysis to find out which option should be better. Here is the final model that we are planning to create.
Another thing. You know our Rational Will ® software is a bundle of tools that contains the "Decision Tree" module. So, if you come to this page from the Rational Will software, then, know that the documentation for Rational Will's Decision Tree and the stand-alone Decision Tree software is the same. So, you will be redirected to this same page for documentation if you check the documentation link from Rational Will.
Ok, first thing first. Let's start with the SpiceLogic Decision Tree software. You will be greeted with a window like this. You will see this same window if you click the "Decision Tree" button from the Rational Will software's start screen.
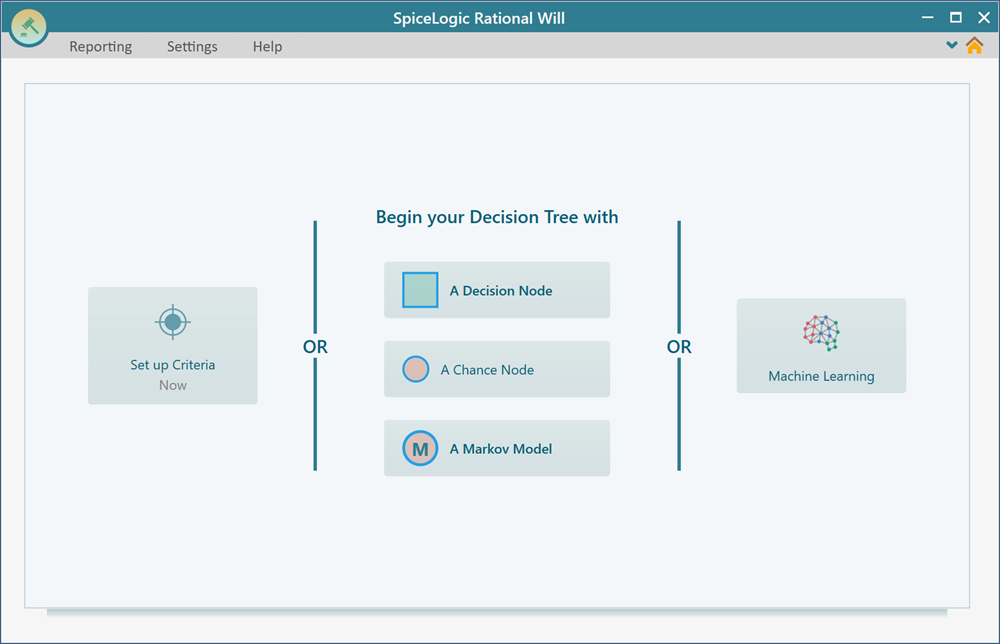
In the center, you see "Begin your Decision Tree with" and four buttons. "A Decision Node", "A Chance Node", and "A Markov Chance Node". These buttons are for deciding what node will be the root node of your decision tree. In most regular cases, a Decision Node is used as the root node of a decision tree. You can choose a Chance Node if you want to perform just probability analysis. A Markov Chance node can be chosen to create a Markov chain or Markov decision process, which we will talk about on a different page. But, let's focus on the Decision Node here. Click the button "A Decision Node". You will see the following window.
Creating Decision Node and Actions
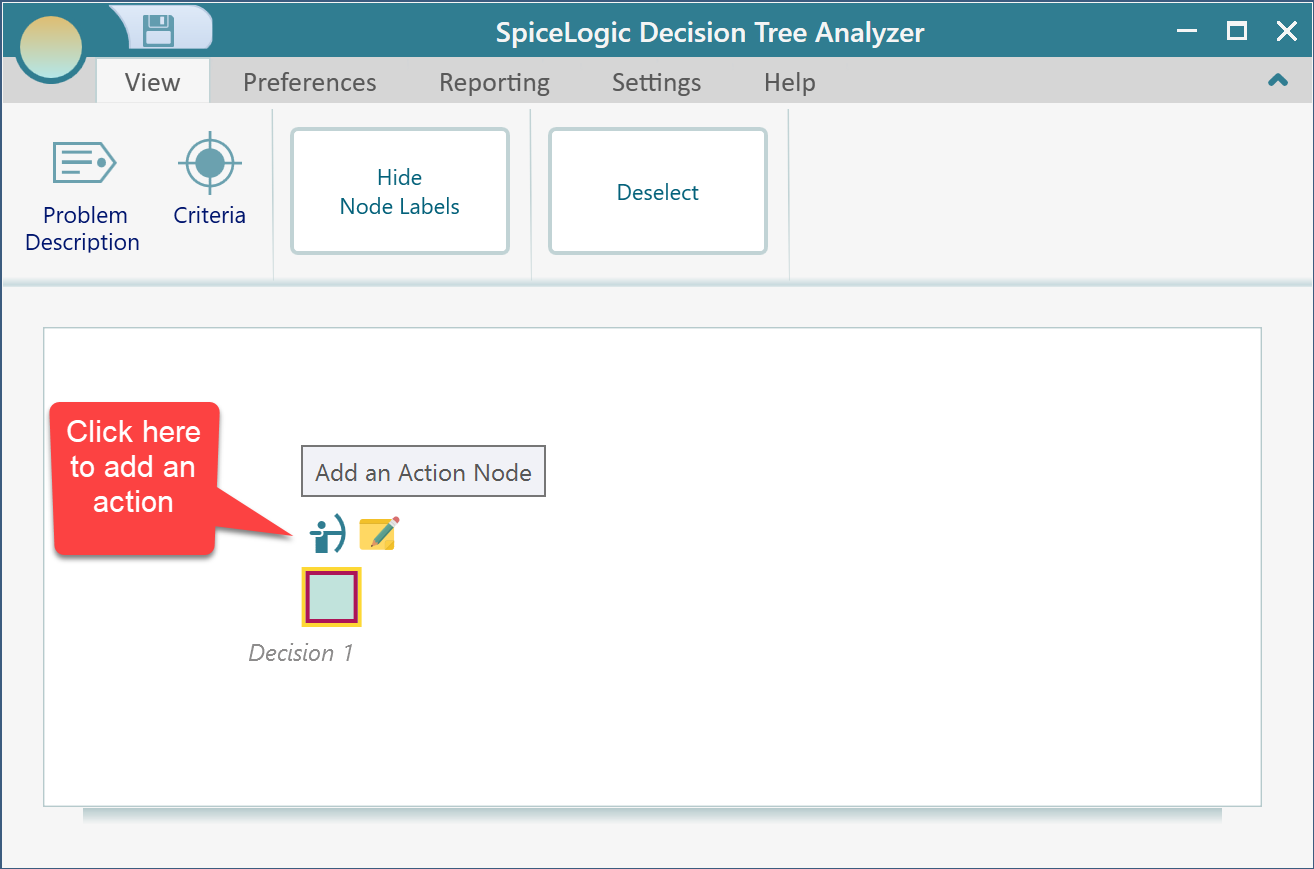
Notice that there is a flyover menu. For every node you select, you will see a fly-over menu for letting you create various types of children nodes. So, you really do not have to wonder about where to find the controls.
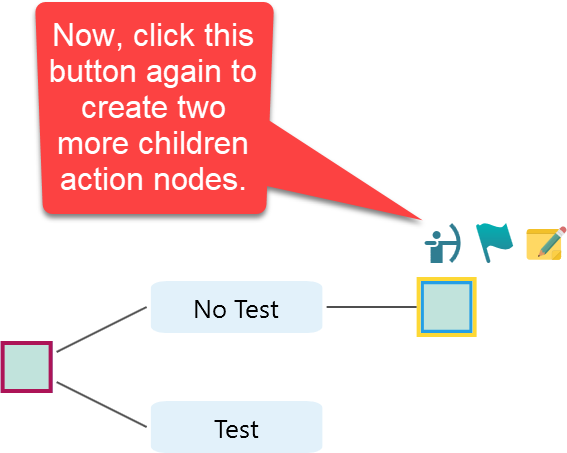
Click on the flyover menu for creating an action node as shown in the above screenshot. Click that fly-over menu two times to create two actions like this.
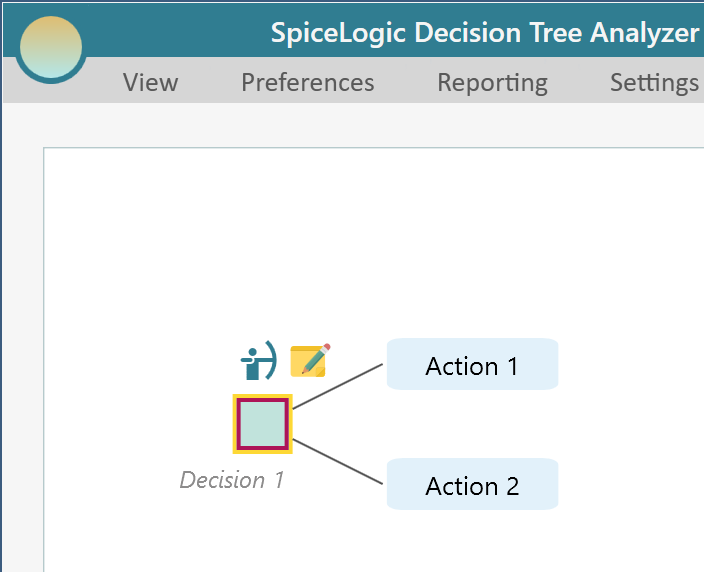
Now, it is time to edit the text. Simply double-click on an action node to turn the node into an editable text box.
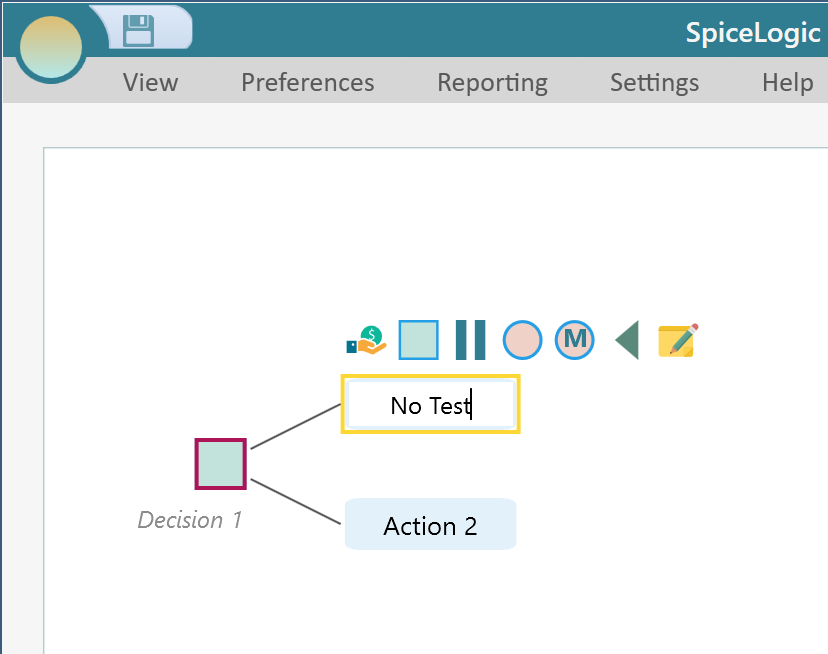
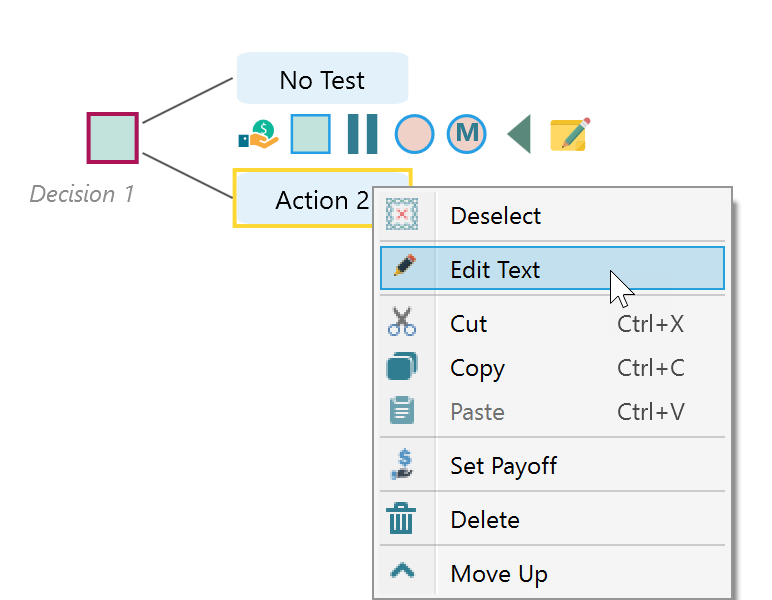
You can also use your mouse to right-click to bring the context menu of a node to find various options, like Edit, Delete, etc.
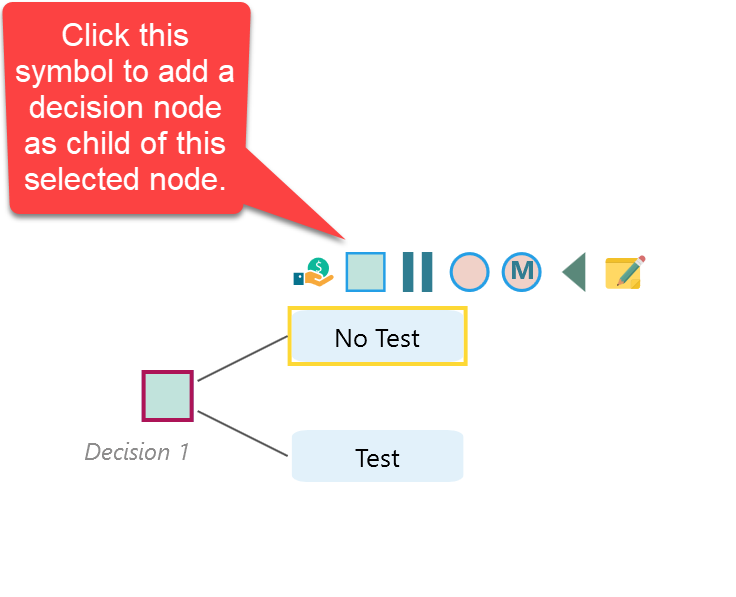
Ok, once you edit both node texts as "Not Test" and "Test", select the first "No Test" action node, and from its fly-over menu, click the square symbol to add a decision node as a child of the "No Test" action.
Actually, you do not need to remember, which symbol is for what. The SpiceLogic Decision Tree Software is very beginner-friendly. It will show tooltips everywhere. When you place your mouse over something, you will get a guiding tooltip like this.
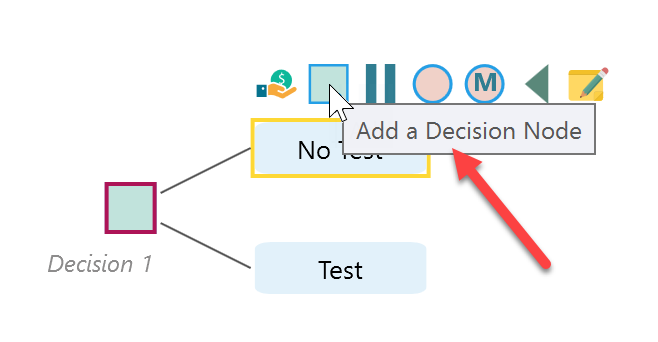
Anyway, click the button as shown above to add a child decision.
Now, same like before, add two more actions under this new decision node and name them "Treatment A" and "Treatment B".
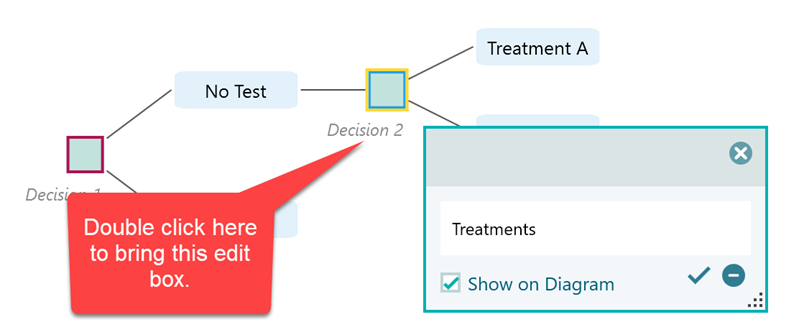
Notice that, the Decision nodes are named Decision 1, Decision 2, etc. You can double-click on this label to change something meaningful. For example, double-click on the "Decision 2" node and you will see the edit box as shown below.
You can hide all these node labels at once if that bothers you. Just click this button from the view menu.
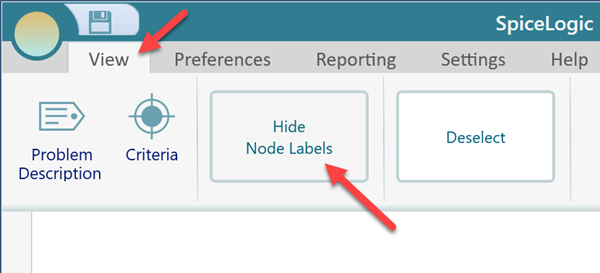
Let's hide it to keep our tree clean.
Adding Chance node and Events with probabilities
Ok, now, select the first action node of this new decision node named "Treatment A" and you will see the fly-over menu again. This time, select the following circle to click to add a chance node.
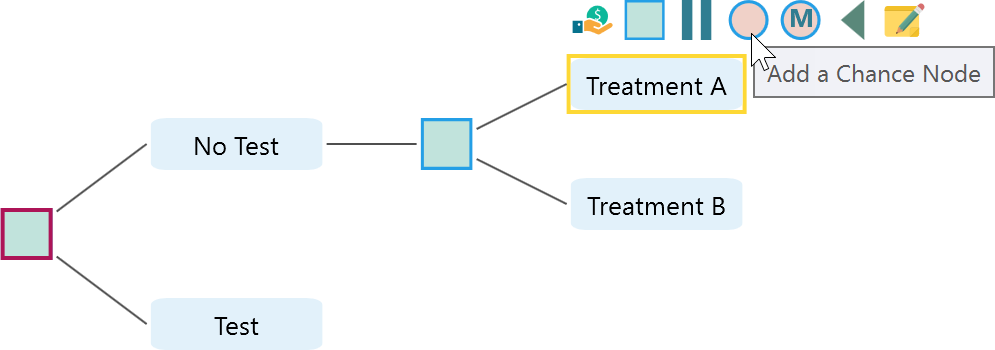
Once you added the Chance node, select the chance node to bring it's the fly-over menu. Now, from this fly-over menu, click this button to add two event nodes.
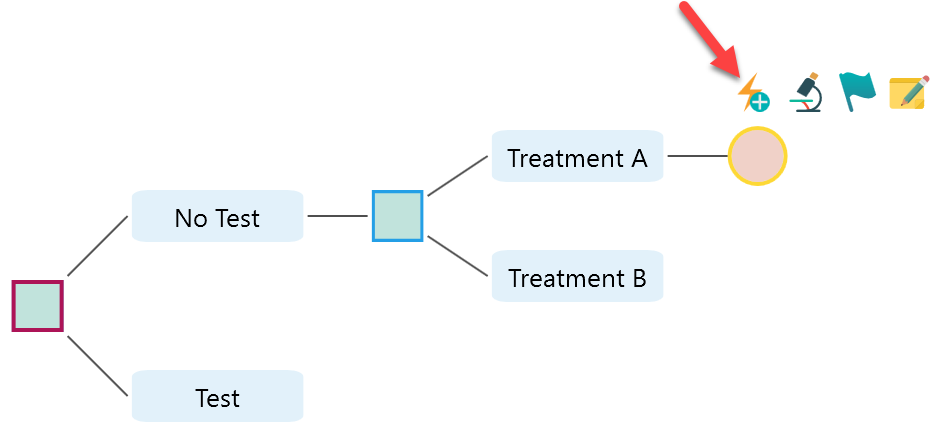
Notice that, the decision tree software will display only valid possible child node types to be added from the fly-over menu.
Once you added the two events, same as before, double click on the event nodes to rename them as Success and Failure. Then, notice this '?' mark on the edge, that tells that, the probabilities are unknown. As the probabilities are unknown, the principle of indifference will be used to determine their probabilities for calculation purposes. The principle of indifference says that, if there is no reason to believe that one event is more probable than another, then assume equal probabilities for all the events. Therefore, in this case, as there are two events, their probabilities will be determined as 0.5 each. As you see the tooltip explains that.
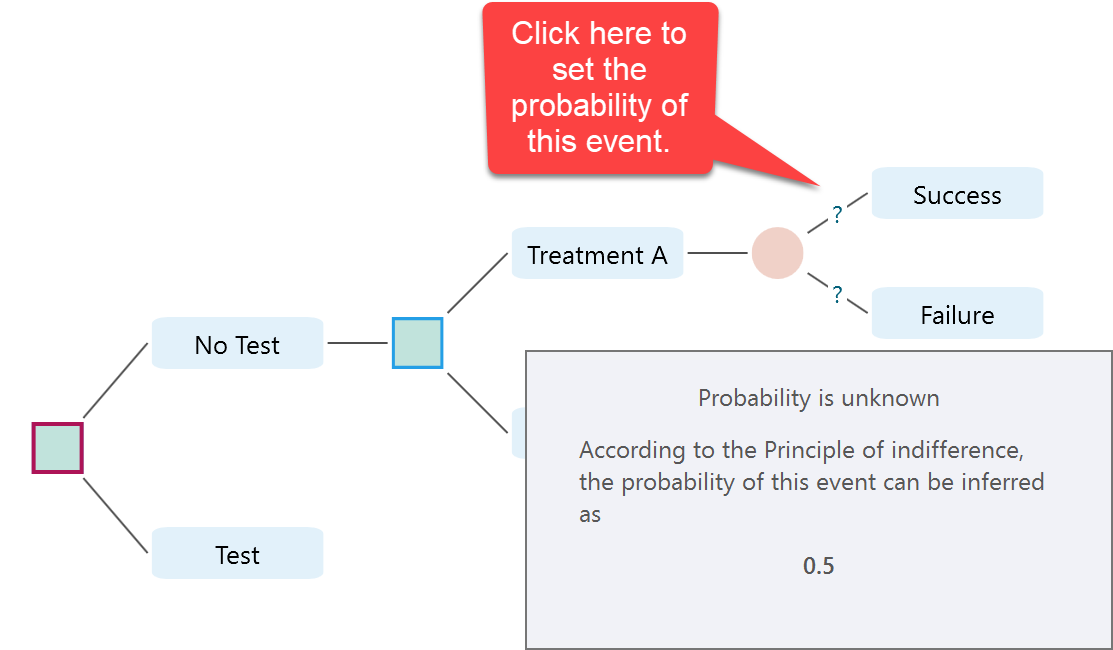
Now, click on that '?' mark to specify a probability. Then, you will see a message box as shown below. Click the button "I know the probability".
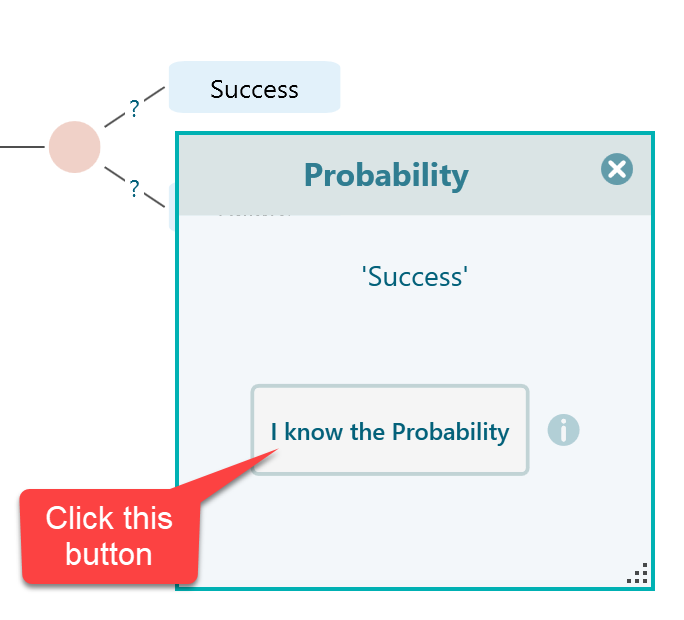
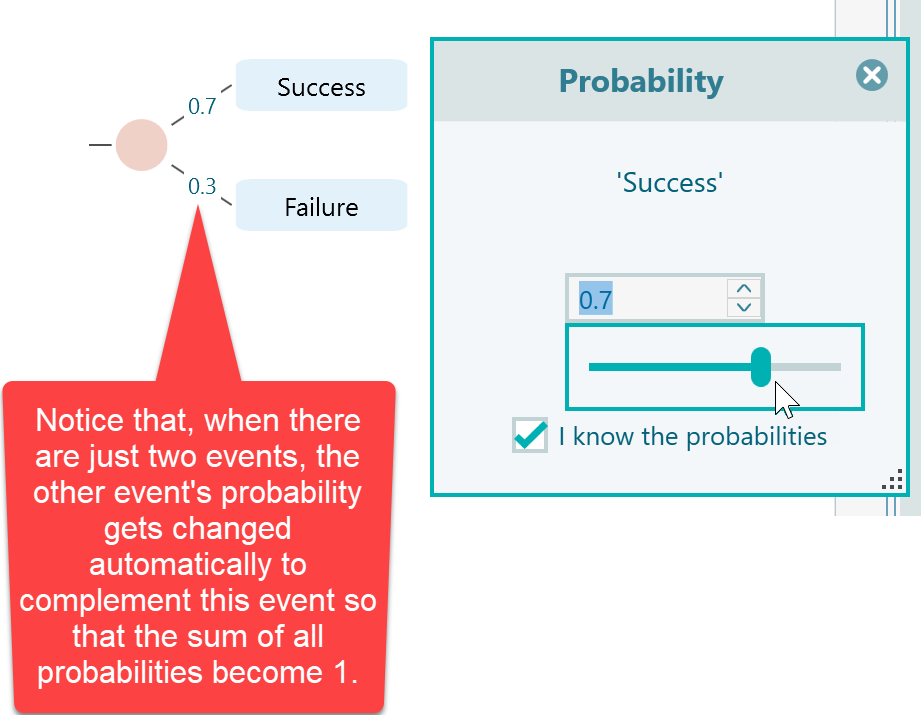
Then, set the probability of Success. Say, it is 0.7. Notice that the other event's probability is calculated as 0.3.
Copying and Pasting
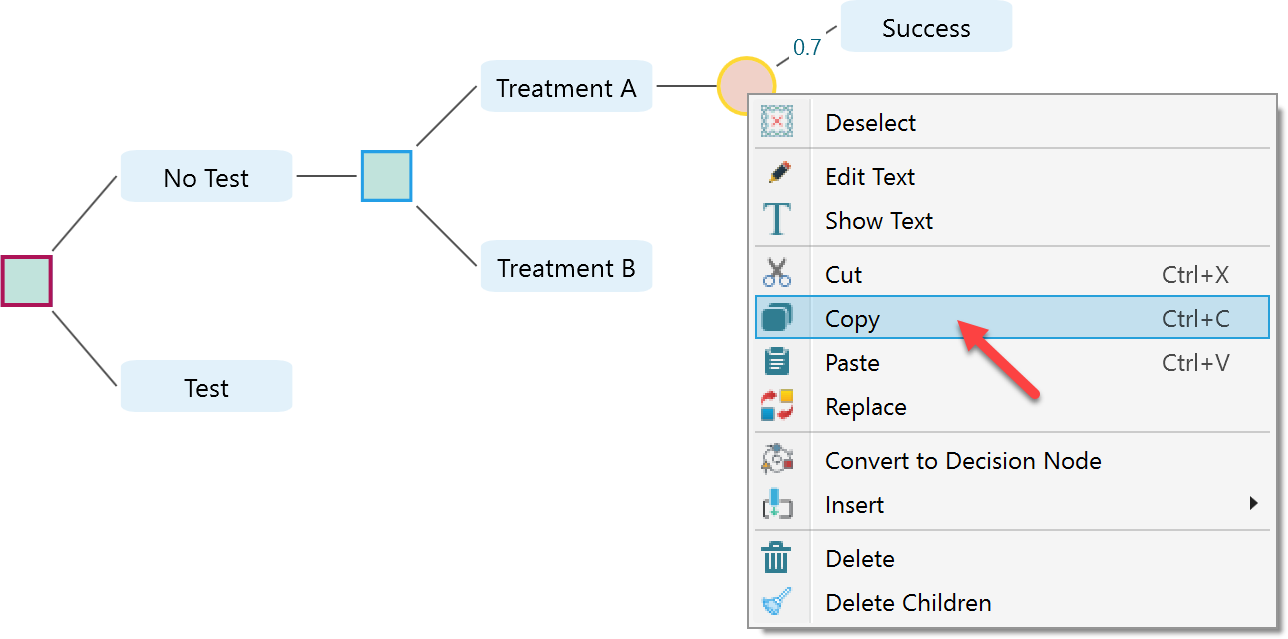
Now, begins the fun part. Select the chance node and use the mouse right-click to bring its context menu. See that there is an option to Copy. Select that option. You could use the keyboard shortcut CTRL+C as well.
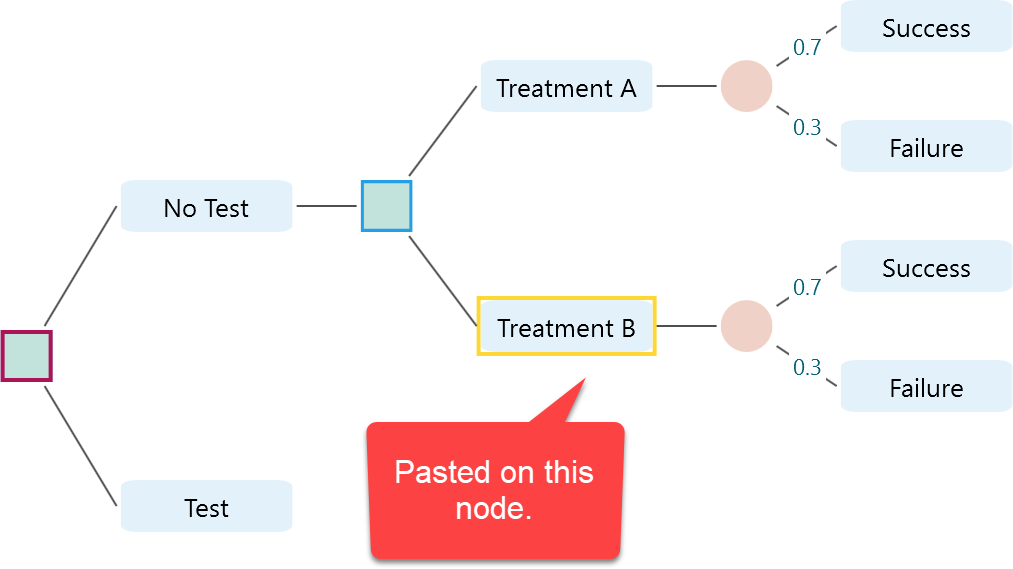
Now, select the "Treatment B" node, and right-click to bring it's a context menu. This time, you will find the option "Paste". You could use the keyboard shortcut CTRL+V as well. After pasting this chance node, you will get a tree like this.
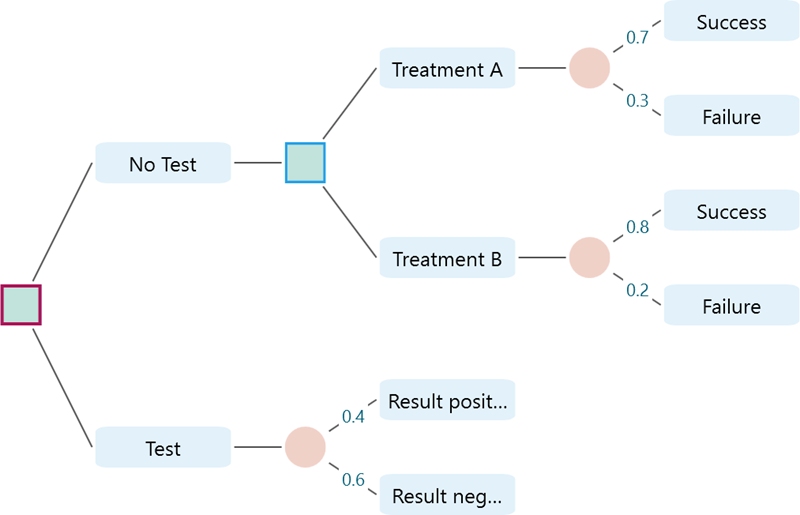
After pasting, remember to change the probability of these pasted events to 0.8 (fo9r success) and 0.2 (for failure). Now, select the "Test" action node and add a chance node. You know how to add a chance node as we have shown you already. Once a chance node is added, add two events under this chance node named "Result Positive" and "Result Negative". Set the probability of "Result Positive" 0.4, and the probability of Result negative as 0.6.
Wait, you must be thinking, where am I getting these numbers from? No, these numbers are not written on a stone. Rather, I am just using the numbers from the sample decision tree that I have shown at the beginning of this document. Just scroll up this page and check the decision tree diagram I have shown. I mentioned that, say, you have a decision model that reflects the decision tree diagram as shown in the given screenshot. I am just showing how to create that decision tree model. I hope, now you understood where I am getting these numbers from. Feel free to use any number that you feel is correct for your own context. Ok, let's get back to where we were. If you have followed the instruction, then, by this time, you should have a tree like this.
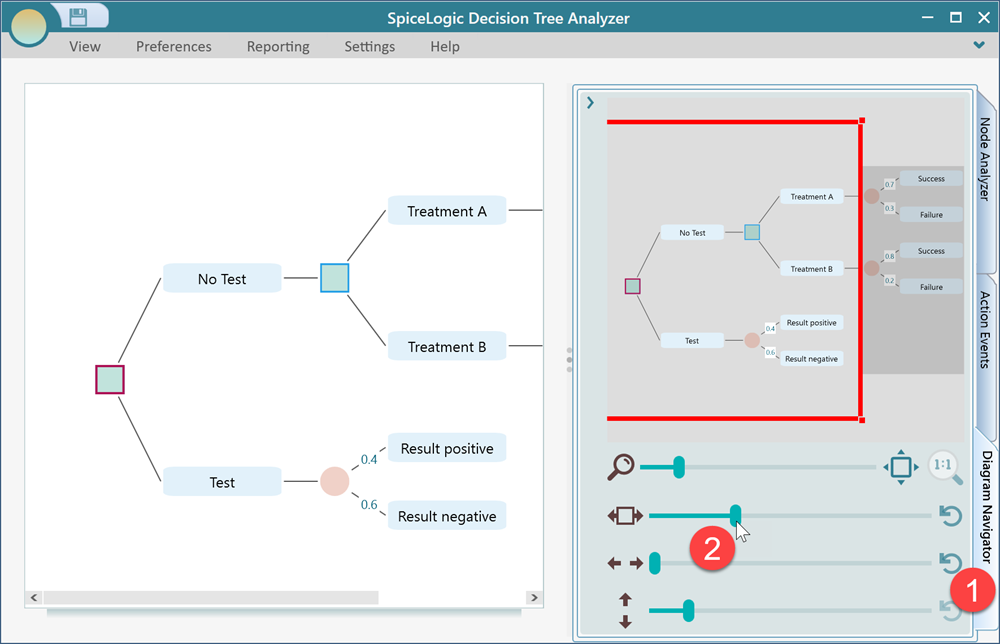
Oops, the Result Positive and Result negative nodes do not show all the text, because, the node width is not wide enough. Ok, expand the diagram navigator tab and use this slider to increase the node width. In this panel, you can see that there are many other sliders to control the horizontal spacing, vertical spacing, zoom level, etc. You can play with each control to find out how powerful this diagram tool is.
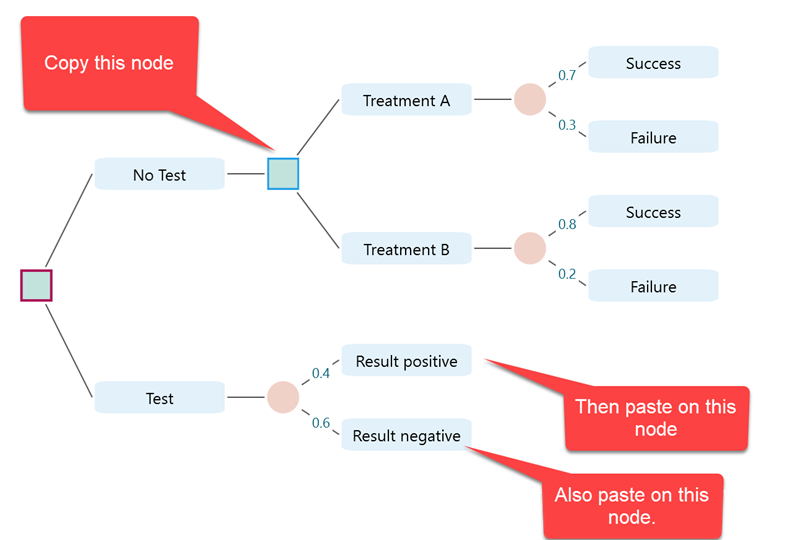
Ok, now you can see the full text. Great. Now, copy the decision node that contains the children "Treatment A" and "Treatment B". And then, paste on each of the events of the result chance event (Result positive and Result negative) as shown here.
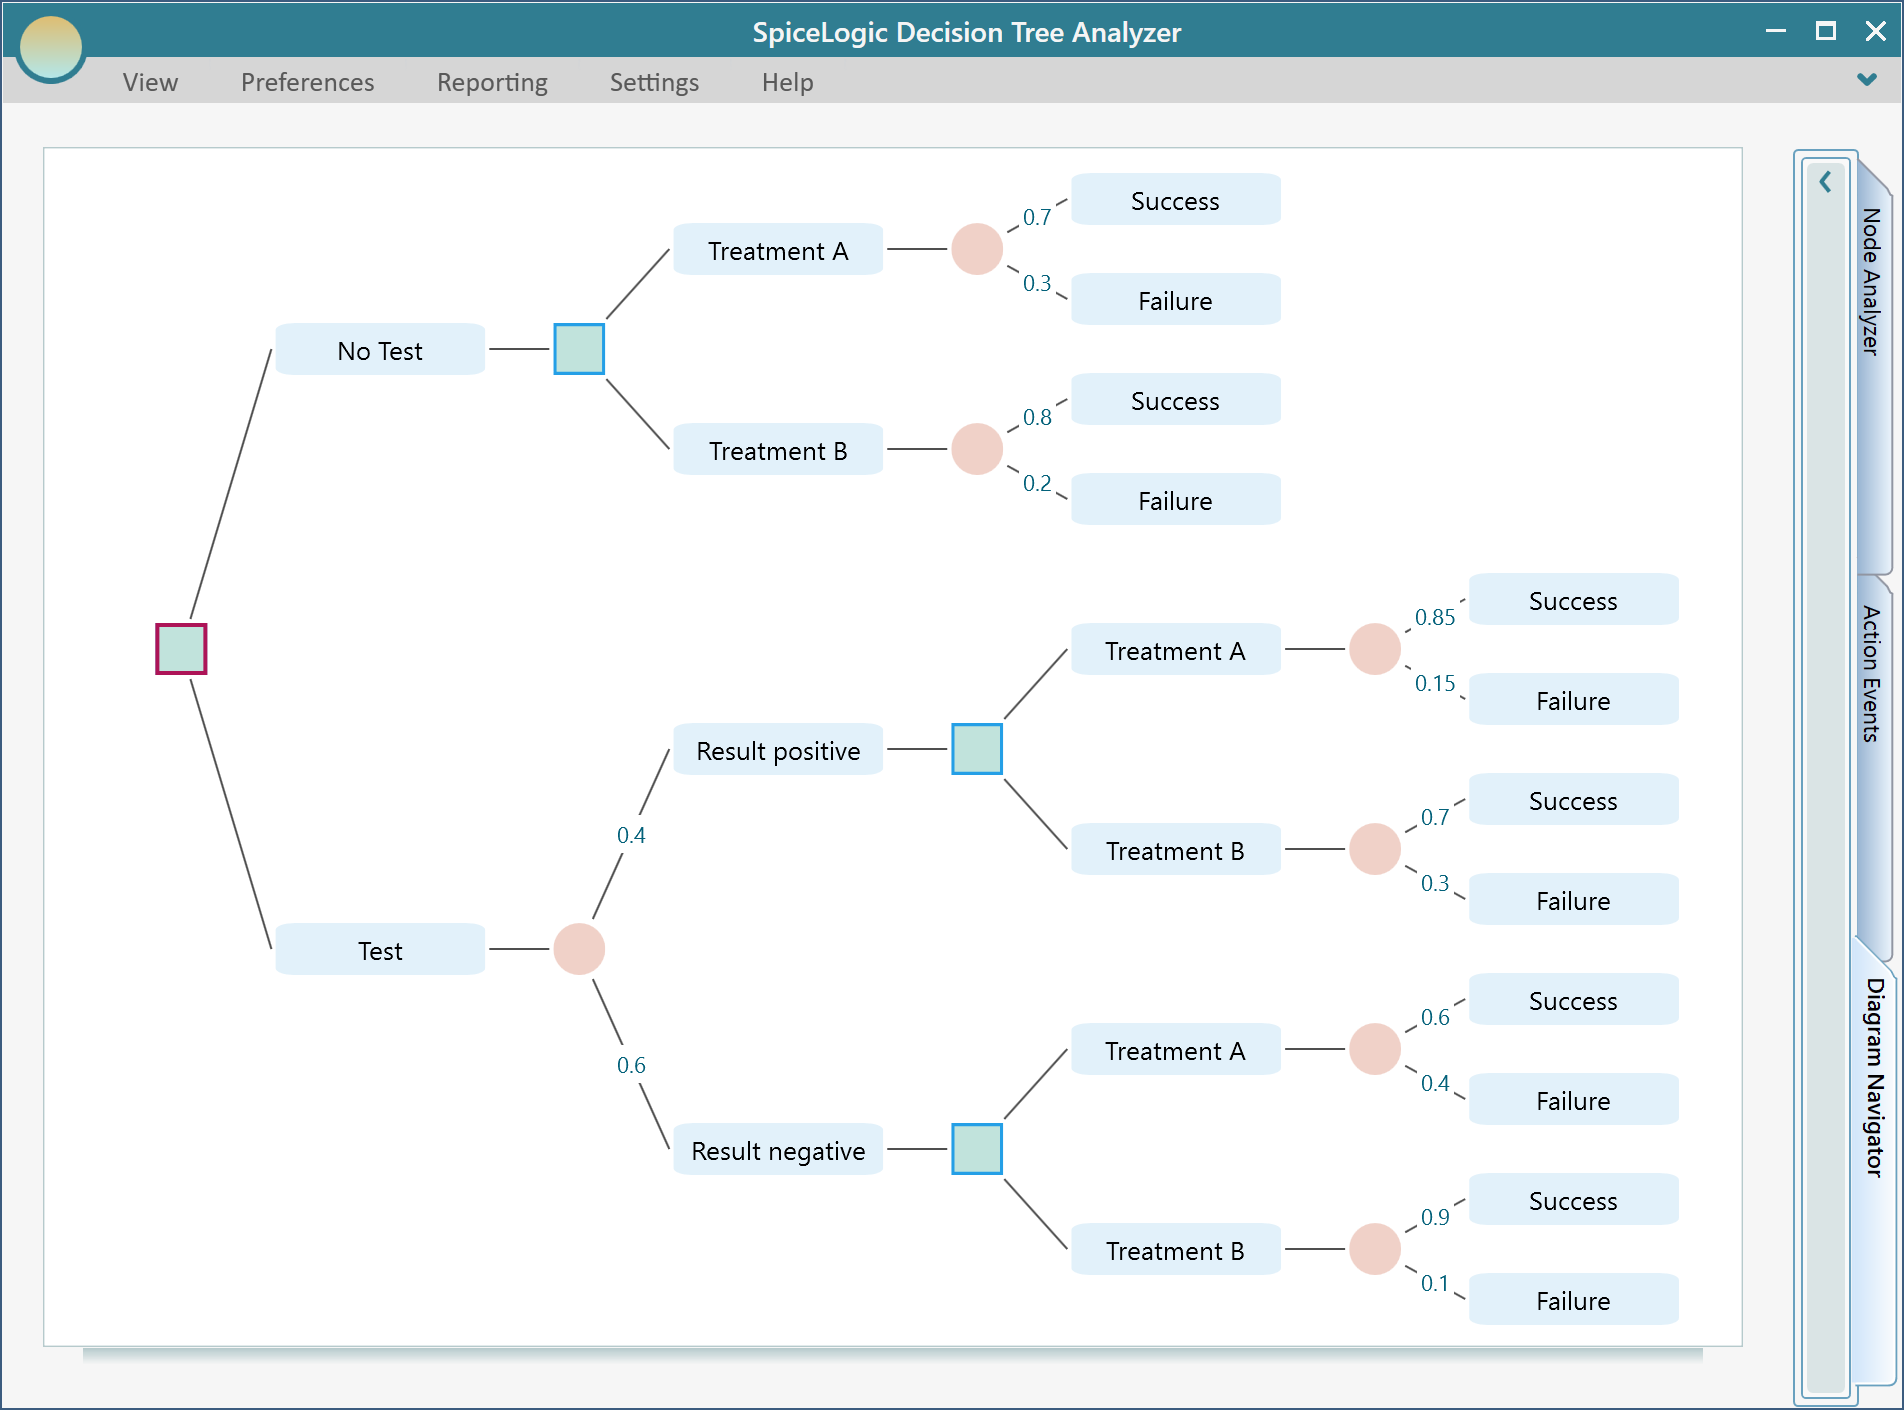
Once you do that, you will see the tree looks like the decision tree diagram shown at the beginning of this document. Now, it is time to fix the probabilities. As you copied and pasted the events, the probabilities are copied from the old subtree. Select each edge and update the probabilities as given in the sample diagram at the beginning of this document. Once you fix the probabilities, your decision tree should look like this.
Setting Payoff
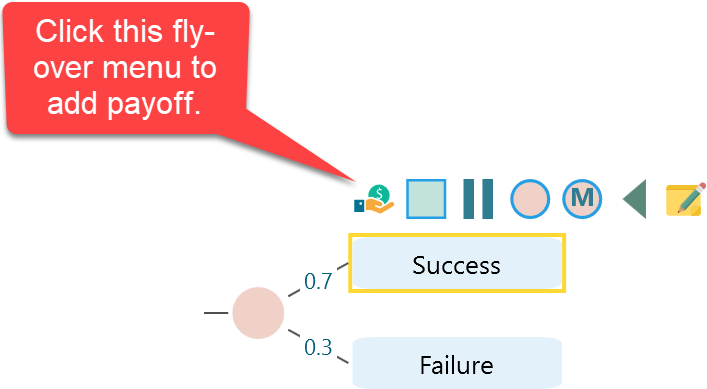
Now it is time to add Payoff. We want to set the payoff for each Success and Failure node in terms of "Life-Years" received by the patient after the treatment.
Click the topmost "Success" node and observe its fly-over menu. You will notice that,
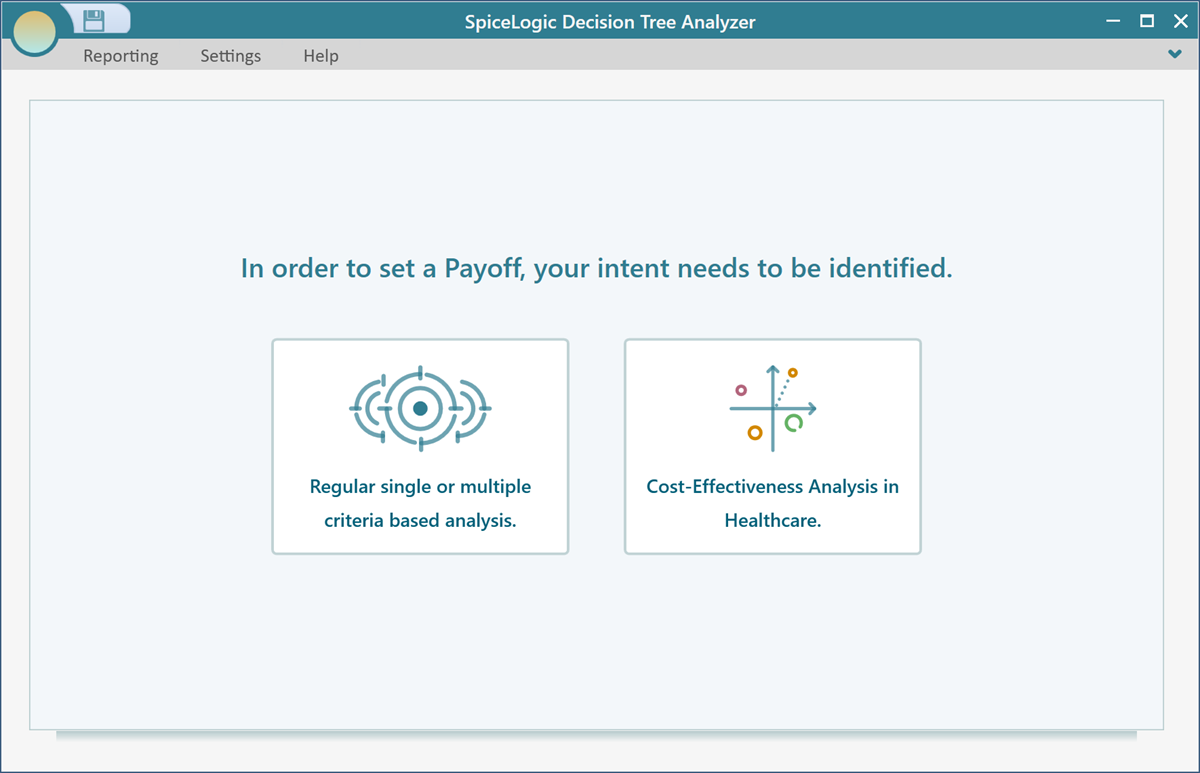
Once you click that payoff button from the fly-over menu, you will be greeted by this window. Because the decision tree software needs to know what type of payoff you want to use in your model. It can be numeric, subjective, boolean, or cost-effectiveness analysis. As you did not configure that yet, the following window shows up the first time when you add a payoff. Once you complete this configuration and the next time you click the payoff button from your node, you will not have to go thru this same process. Anyway, In this window, basically, it is asking you, if you want to perform a regular single or multiple criteria-based analysis or a healthcare dedicated cost-effectiveness analysis. For this tree, you can choose any of these as our payoff is simple one criteria "Life-Year". Let's choose the first button "Regular single or multiple criteria based analysis".
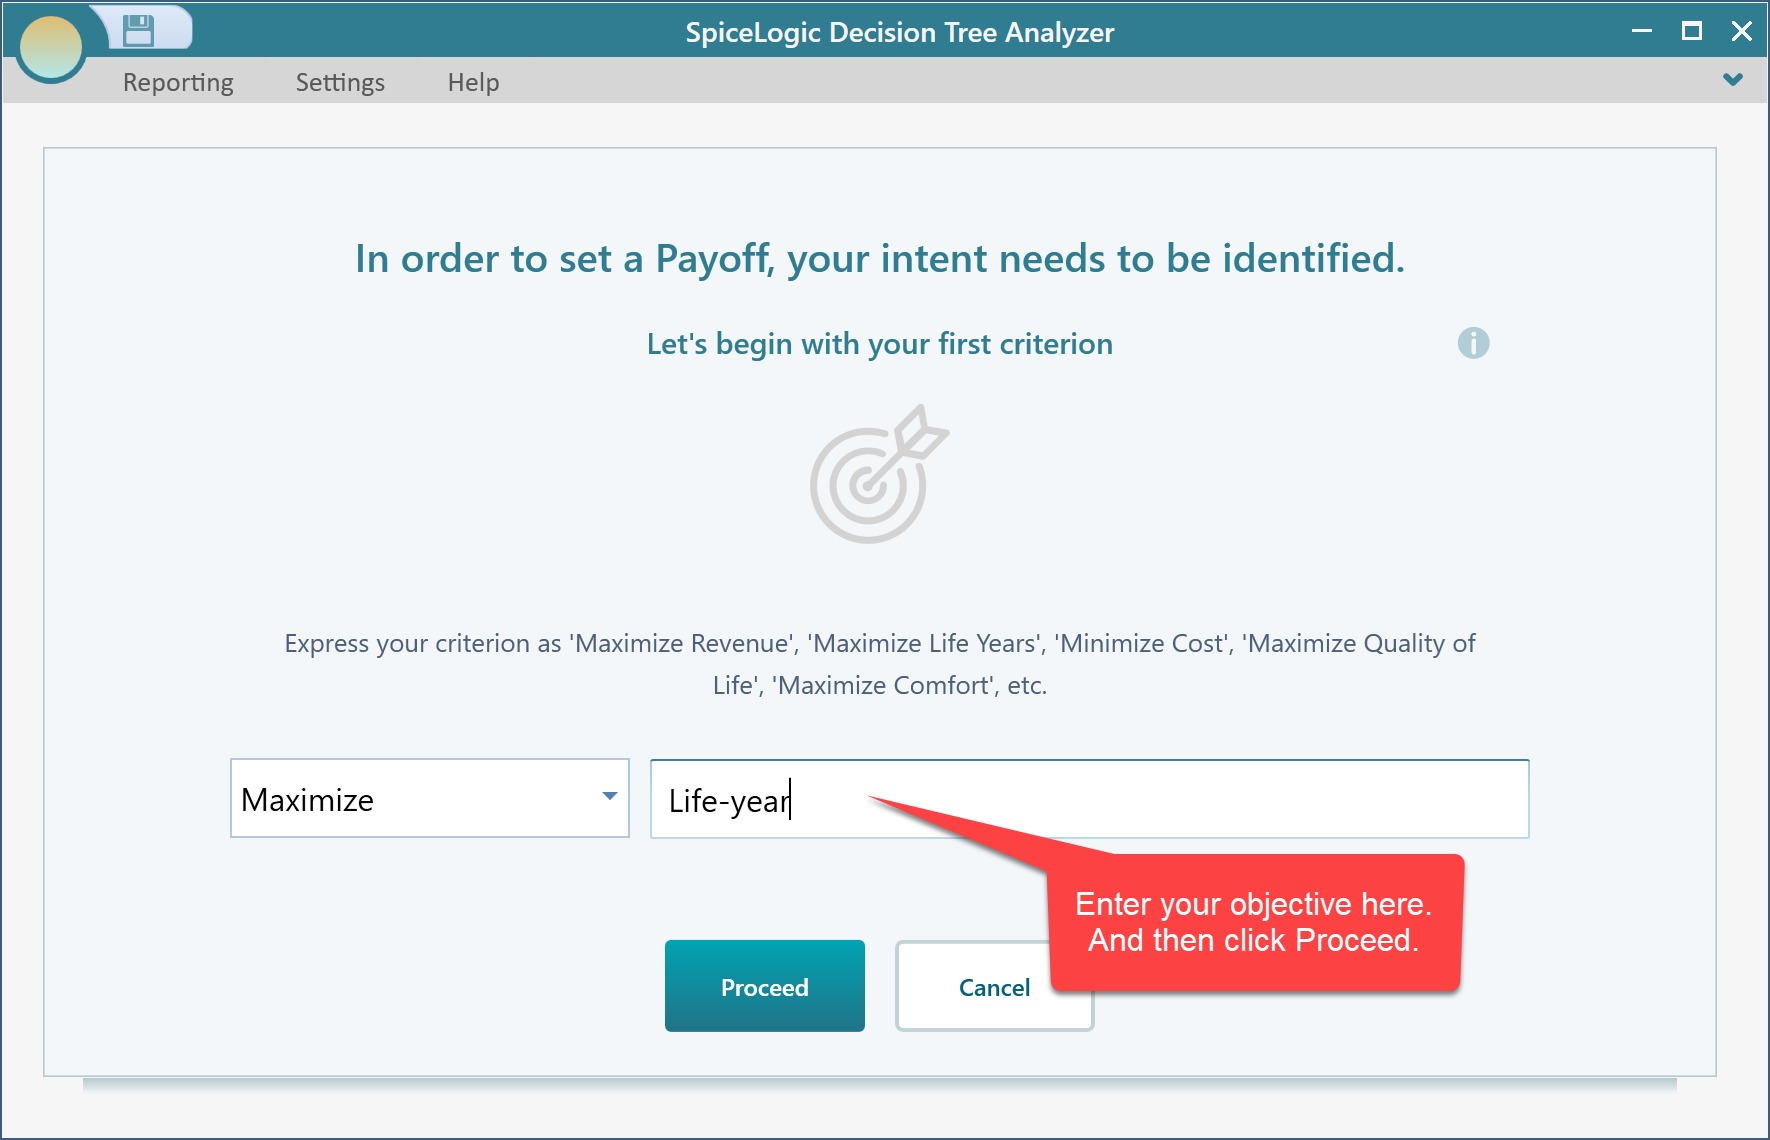
Once you click that first button, you will be taken to a window like this.
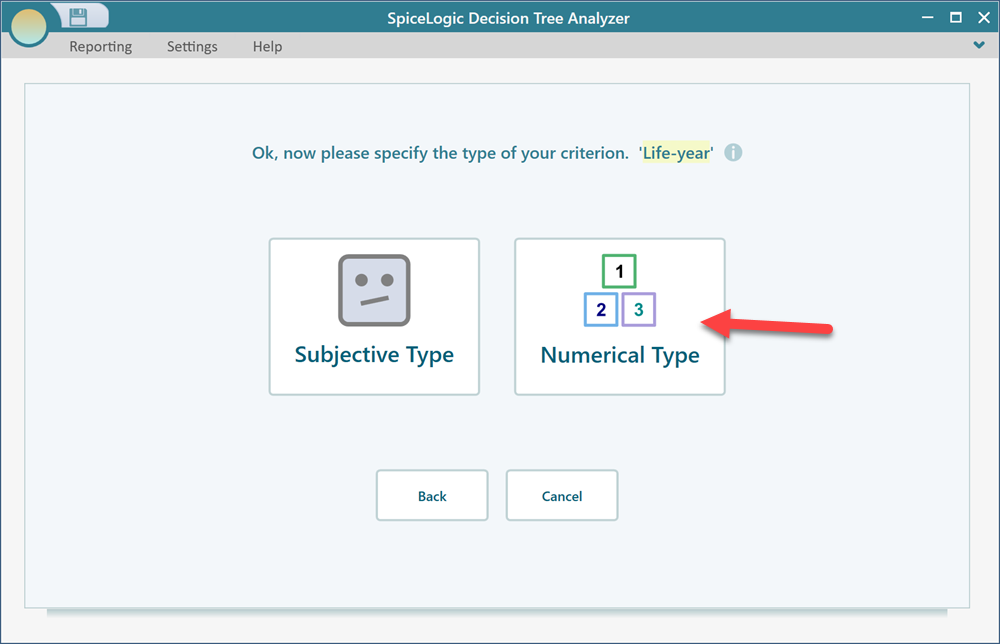
In the next window, you will be asked the type of this criterion. Select "Number Type".
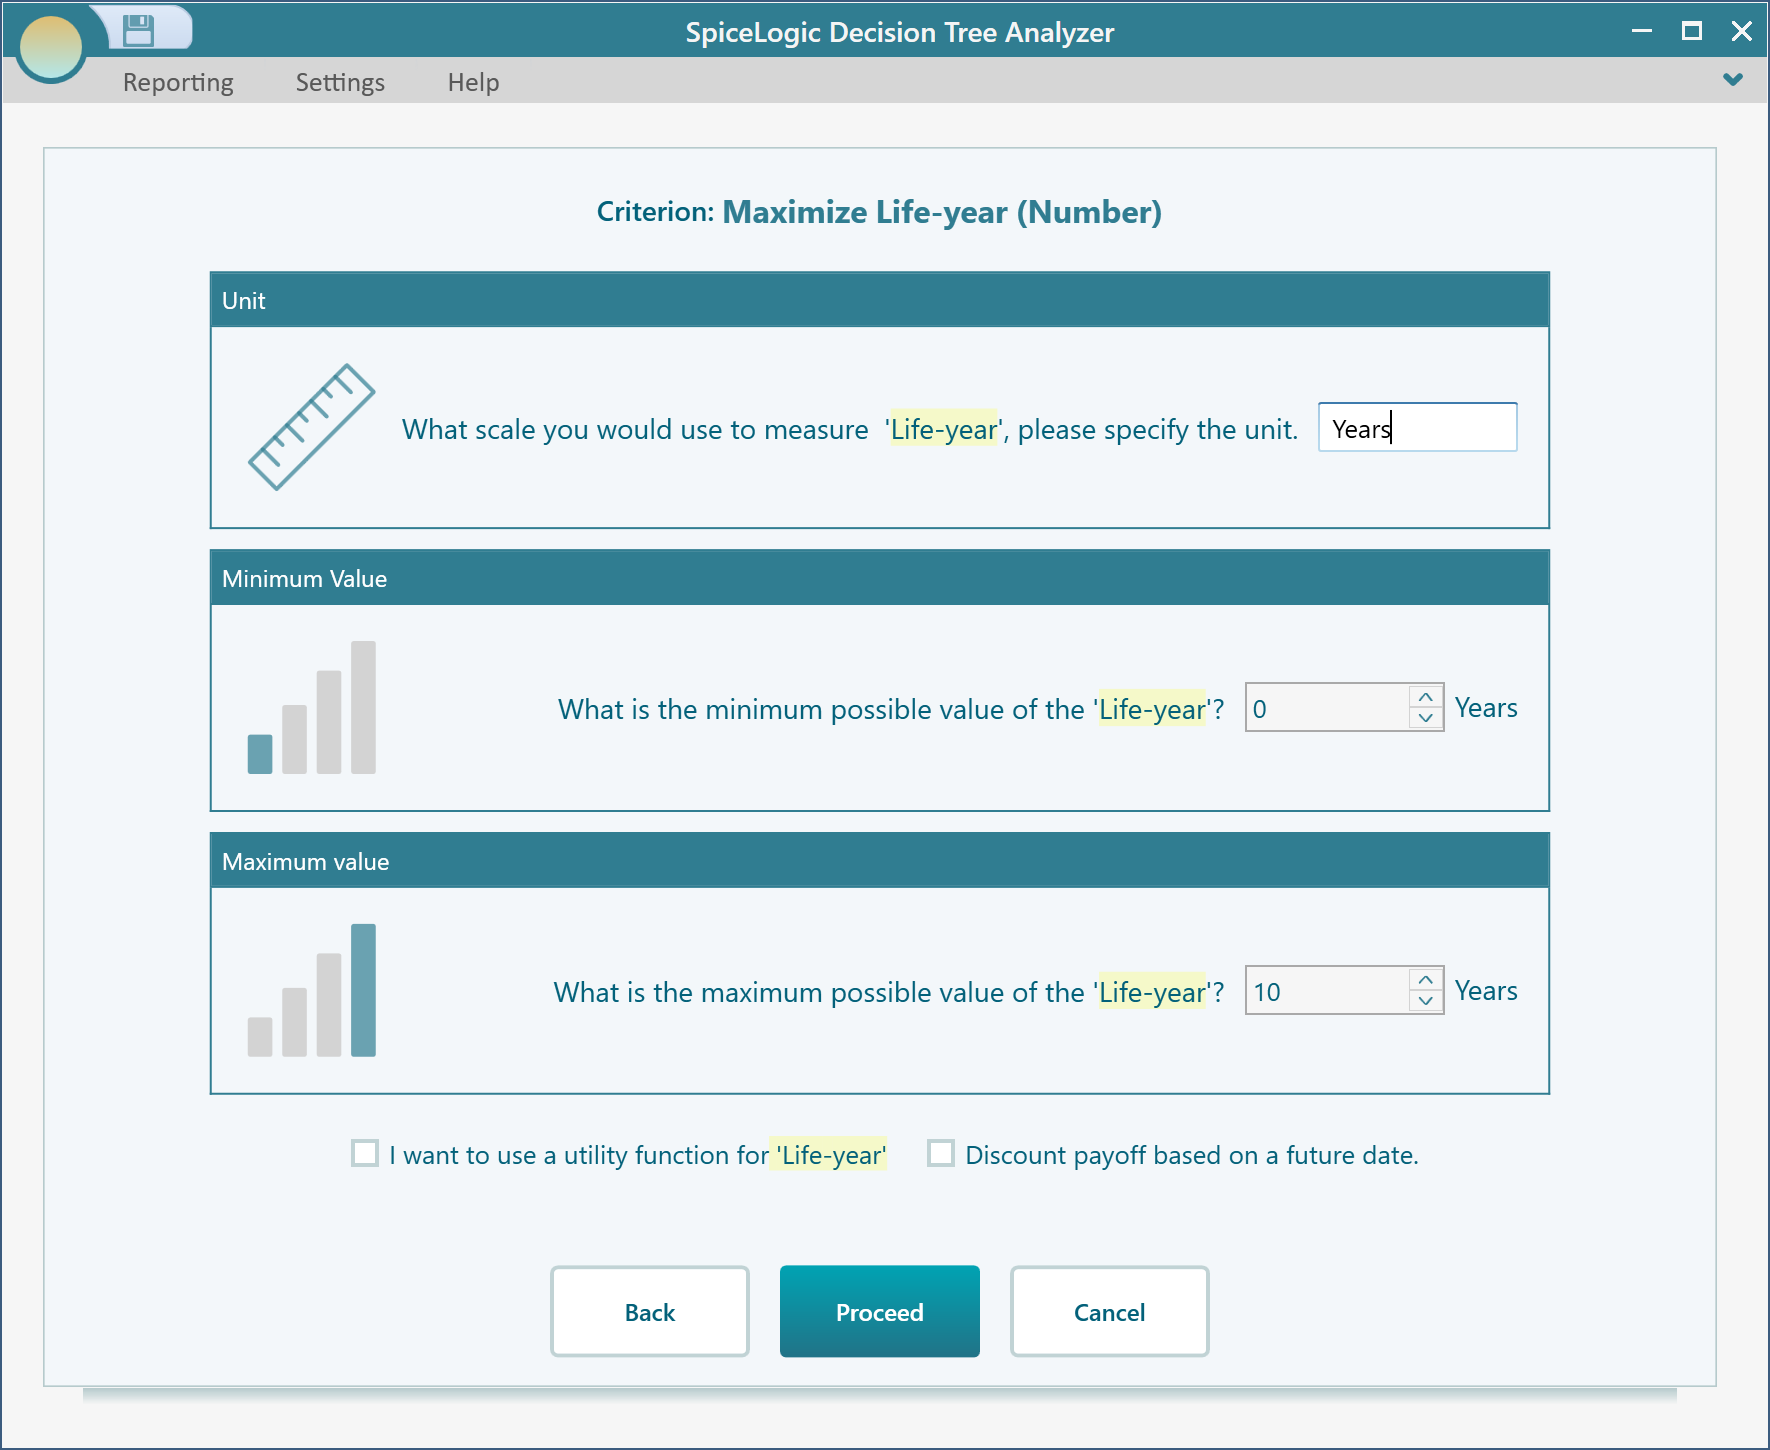
Then, set the unit as "Years". Say, in your model, a life year can be achieved a minimum of 0 years and a maximum of 10 years. Set these numbers accordingly, and click proceed.
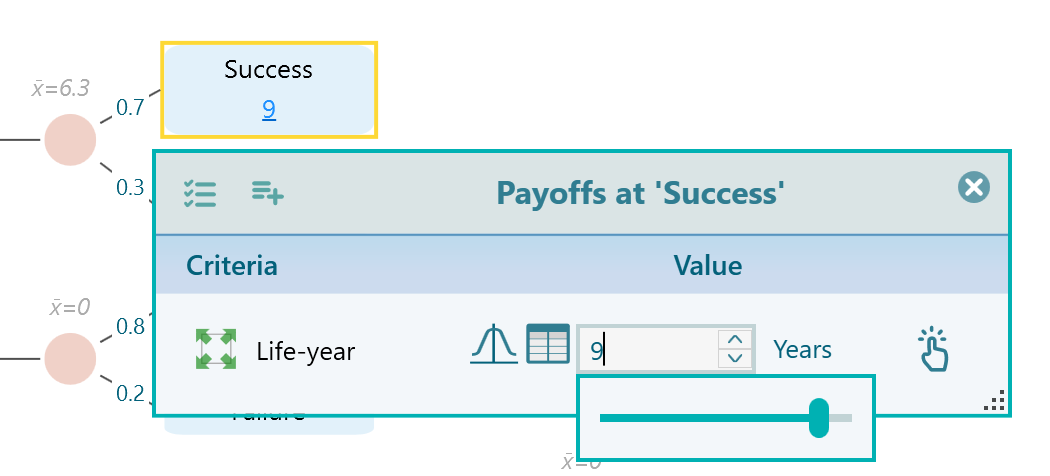
After you click "Proceed", you will be asked if you want to add another criterion. Answer "No", Then, you will be taken to the decision tree again. You will see the top Succes node shows the payoff editor as shown here.
Set the payoff as 9 years as you get it from the reference decision tree diagram.
In the same way, set the payoff for all of the Success and Failure nodes as you got from the reference diagram. Again, the next time you click the payoff button from the flyover menu of the node, you will see the payoff editor directly.
Terminals
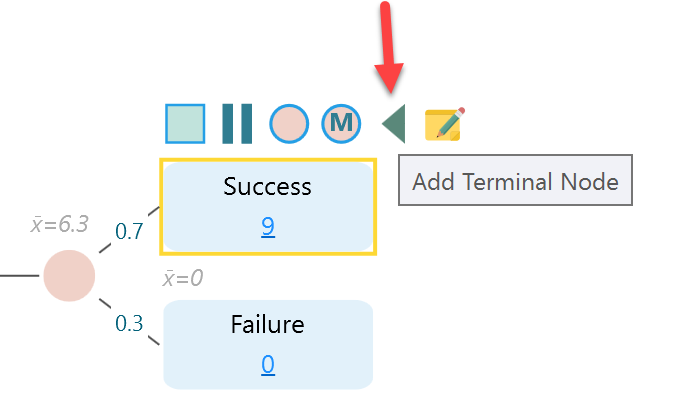
Finally, select each Success and Failure node and you will find a flyover menu for "Terminal Node". Add terminal node so that the total payoff for that node is displayed.
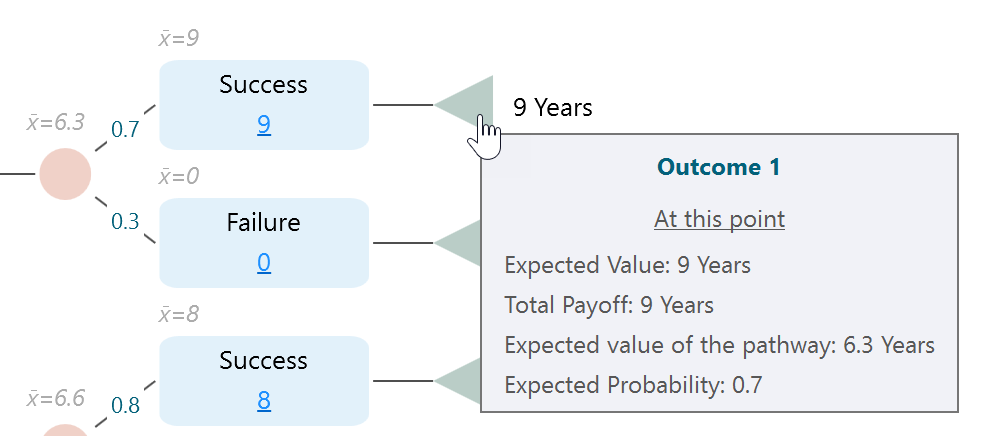
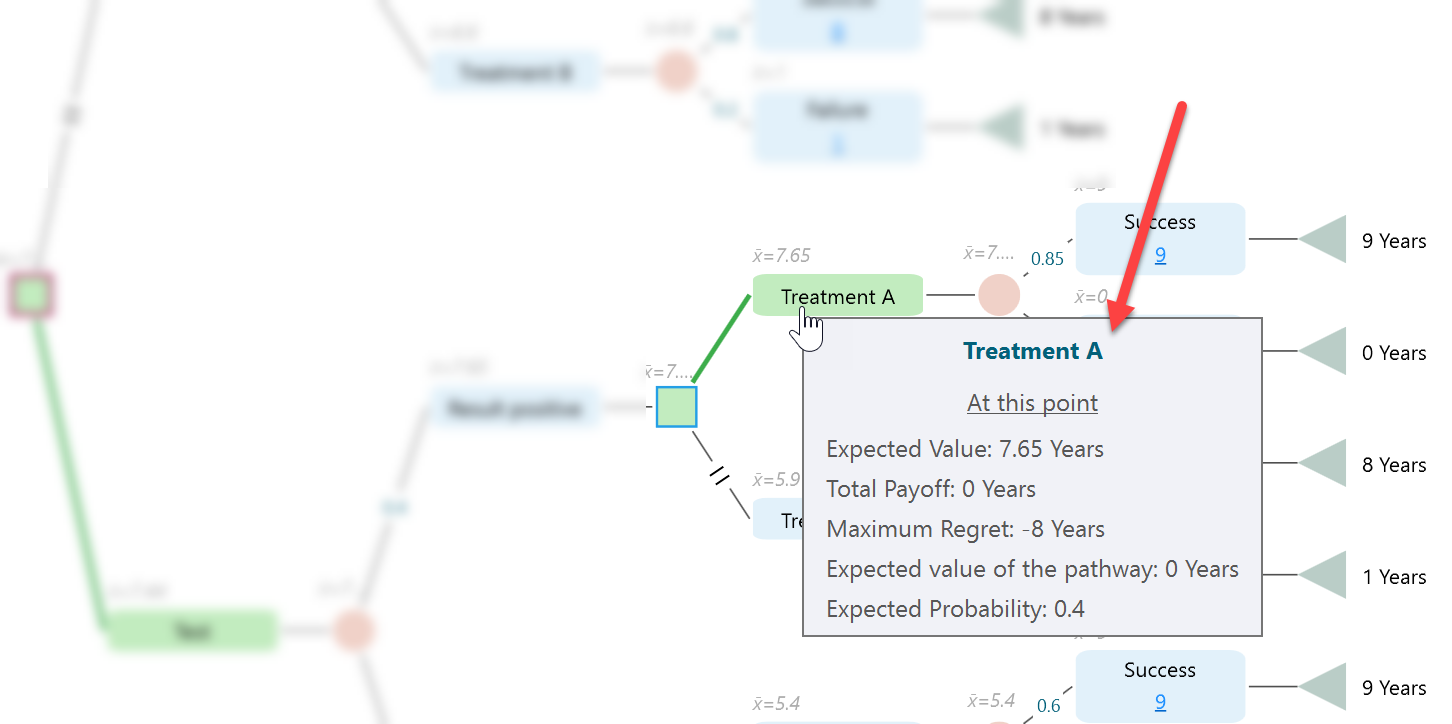
The terminal node gives you a very useful tooltip with lots of metrics.
Analyzing Results and Policy
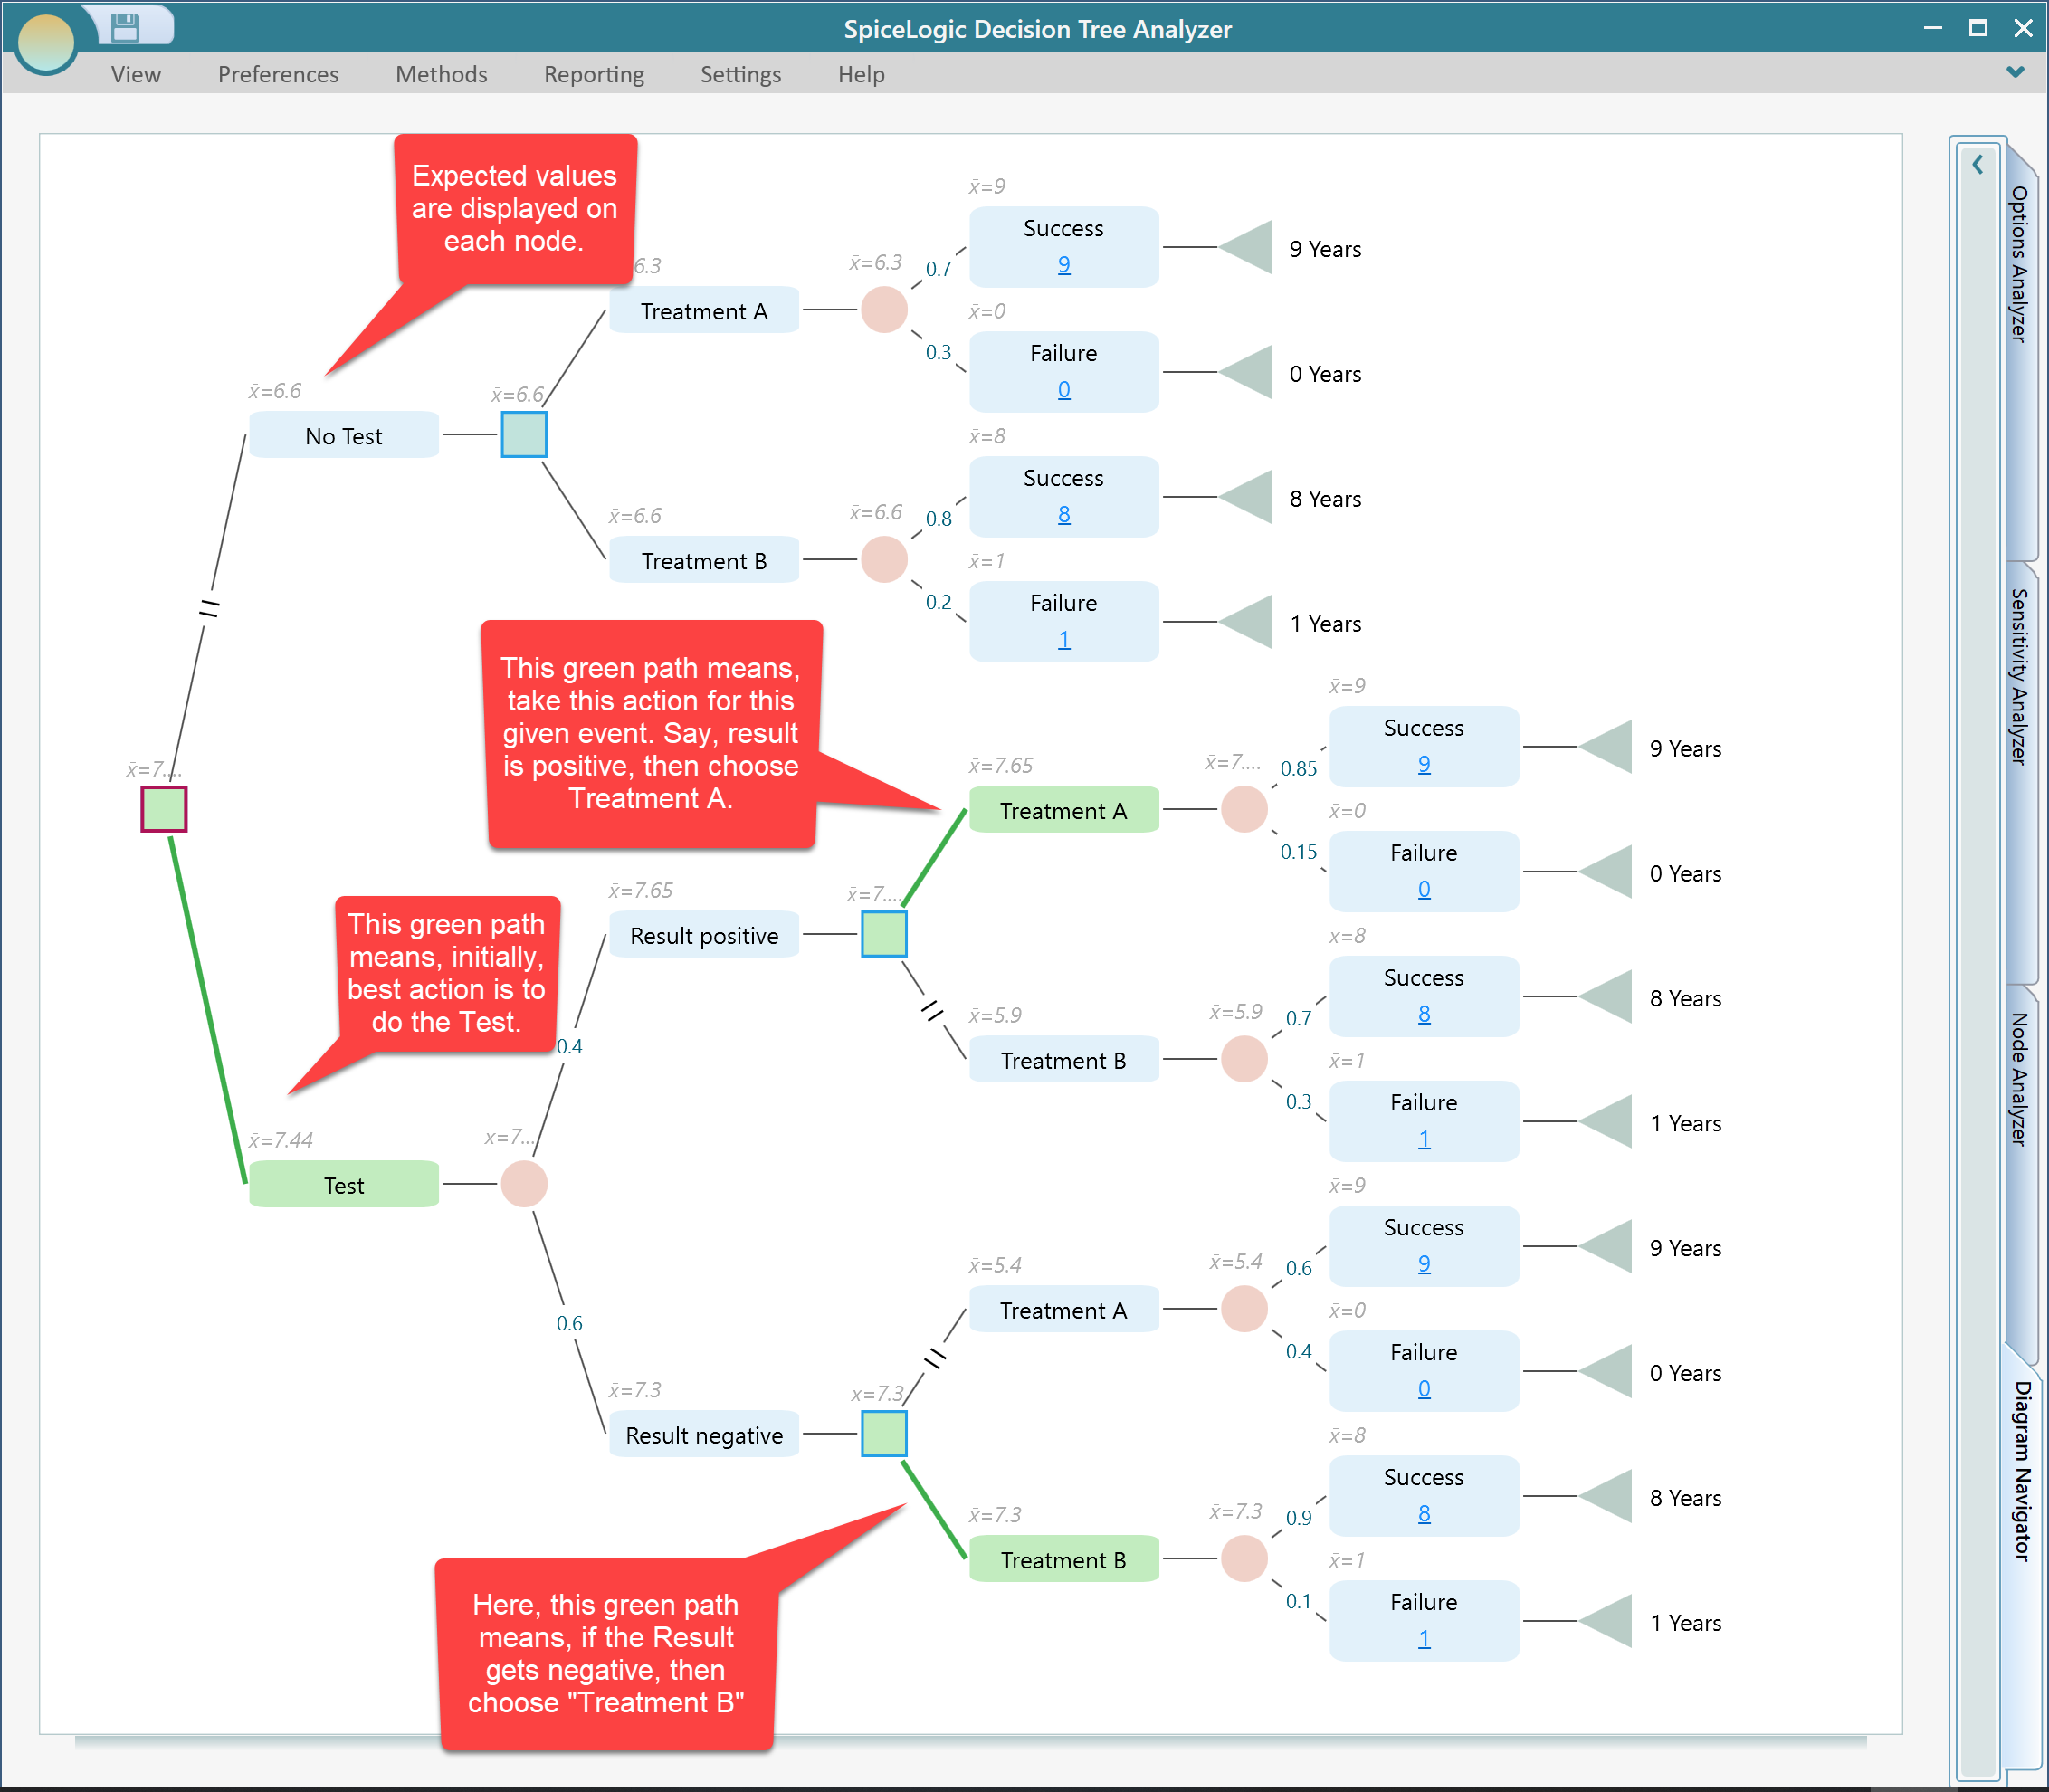
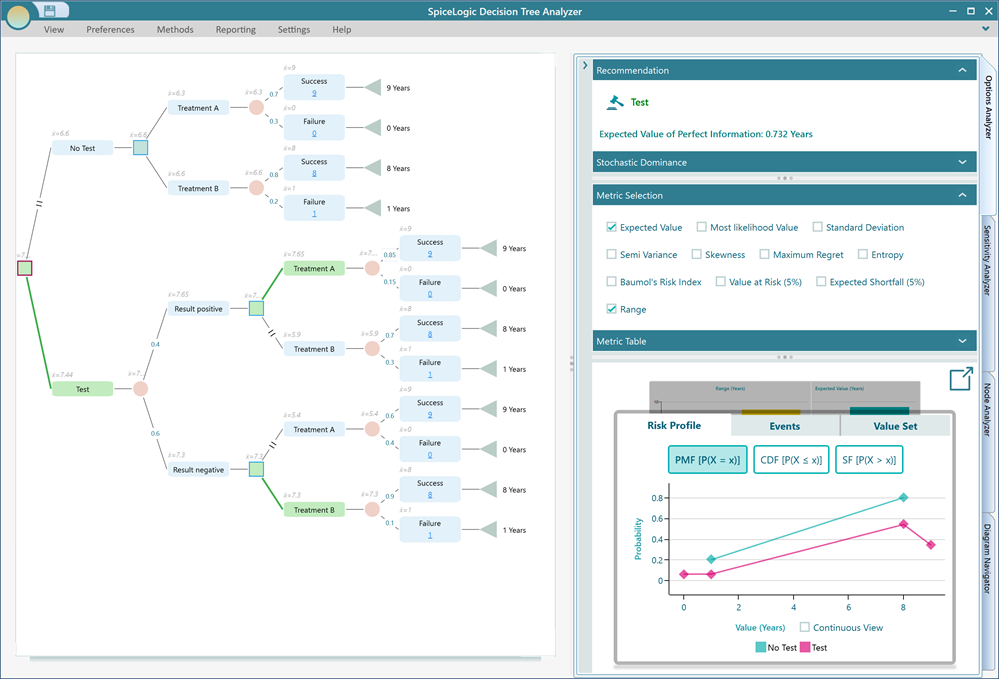
Once you set the payoffs, you will see the decision tree shows the calculated result instantly. Notice the Expected Values are displayed on each node.
Notice that, the recommended (best option) is highlighted as the Green color path. You can see the expected value for the "test" node is 7.44 life years comparing the "No Test" node which has 6.6 life years, the "Test" node is shown as the best action at the root. As you can see, not only the root node contains a Green color path, but also the action nodes that come out after the Result Positive and the Result in the negative show the best action to take for that given scenario. This is called "Policy". This decision tree software is giving you a policy about what action to take in what situation.
Also notice that the tooltip of every node shows various metrics like Expected Value, Total payoff at that point, expected probability, etc.
Now, expand the options analyzer tab to view various charts and metrics.
There is another interesting thing that I want to show you. From the View menu, click the "Policy/Ruleset" button, and you will see the policy as text instruction.

Planning point
Now, you understood the policy. You may think, what if you choose Not to test, then what should be the best policy?
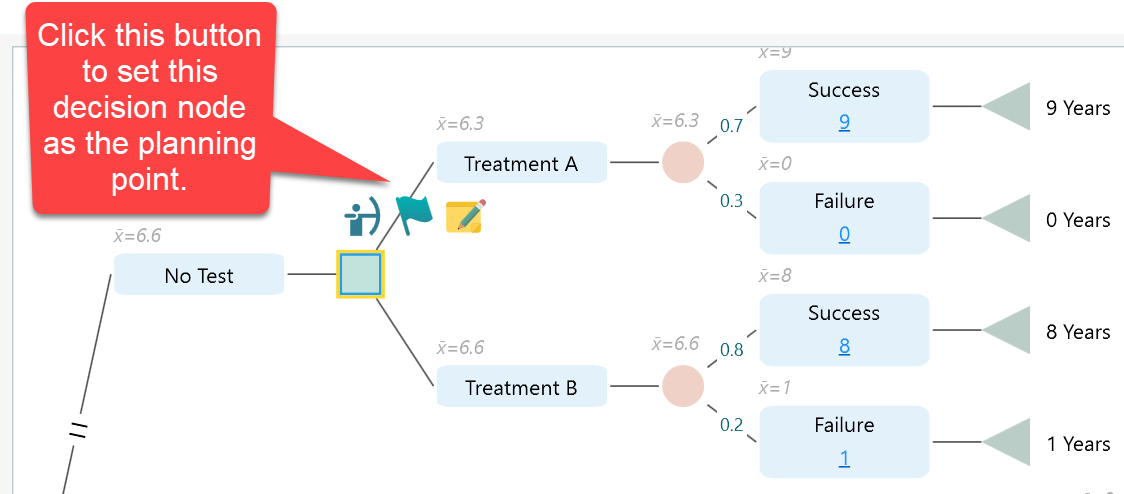
Yes, you can find out by changing the planning point. Right now, your planning point is the root node. Select the Decision node that comes out from the "No Test" action. In the fly-over menu of that decision node, you will find this flag button, which is for setting a node as a planning point. Set this decision node as a planning point by clicking this button.
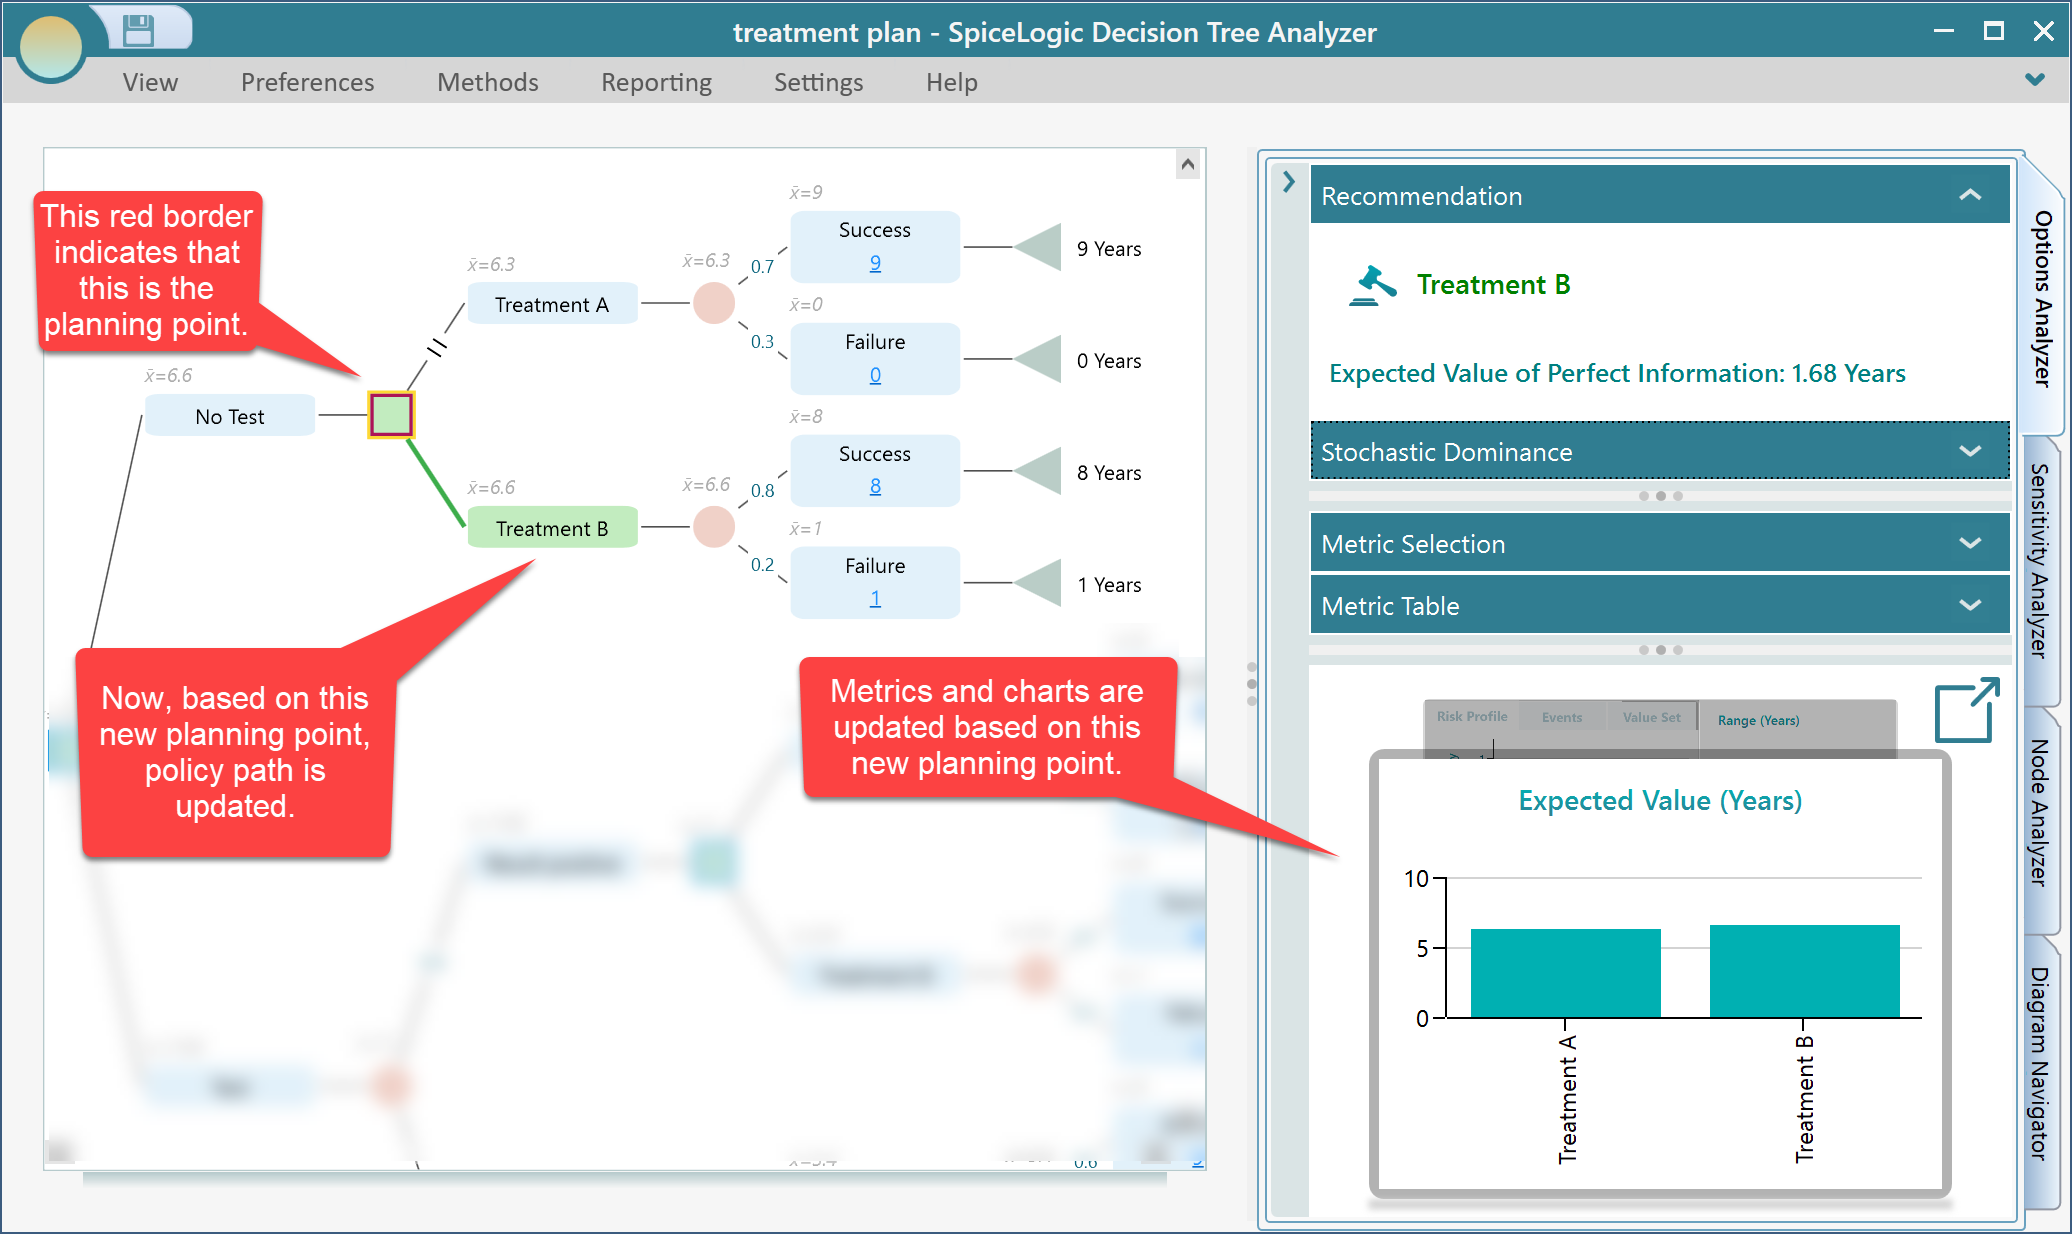
Once you set the planning point, you will see the whole tree is recalculated based on this new planning point. You will see the green color policy path shown from that planning point. Also, all metrics and charts are updated based on the given planning point.
Conclusion
I hope you enjoyed this getting started tutorial. This page is just scratching the surface. You can do a lot of sophisticated analysis using this software. Just check the other documentation pages and play around yourself to find out more and more capabilities.