Decision Tree Node Analysis
For any node in a decision tree, you can mouse over and see a tooltip with lots of metrics. Here is an example.
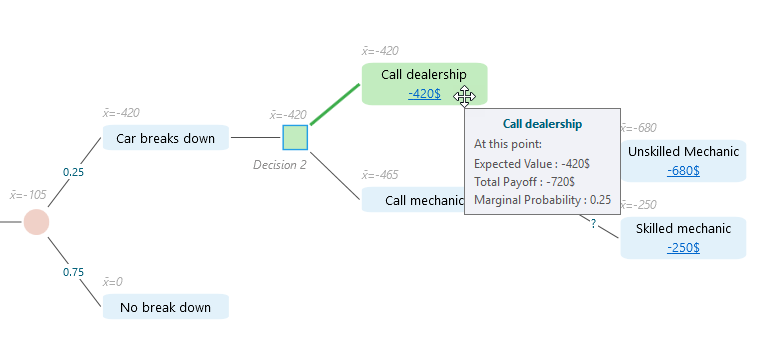
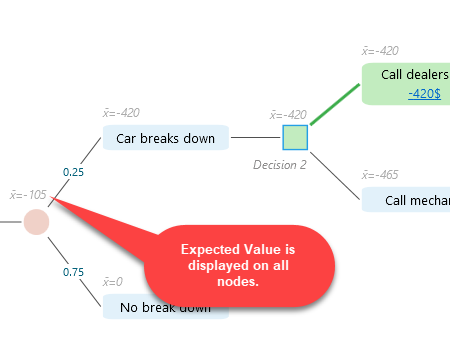
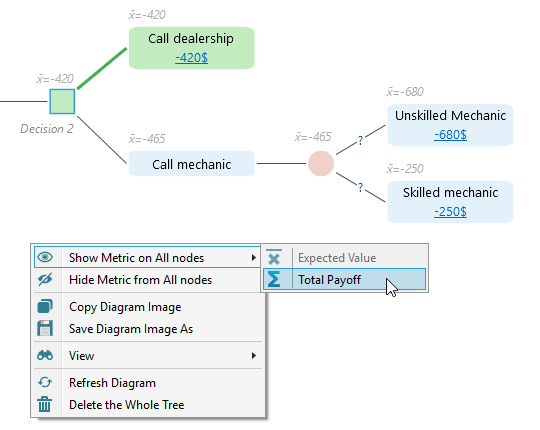
Also, notice that the Expected Value metric is shown in light gray color on every node for a quick understanding of what's going on for each node.
You can choose to hide these gray color metrics for all nodes if that looks noisy. From the context menu of the diagram, simply choose "Hide Metric from all nodes".
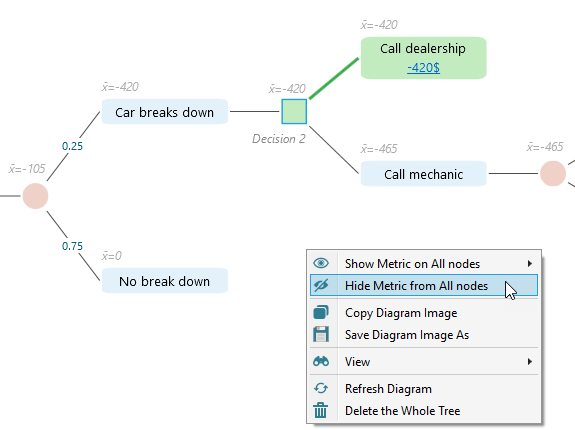
If you want to show Total Payoff instead of Expected Value for all nodes, you can do that too from the context menu.
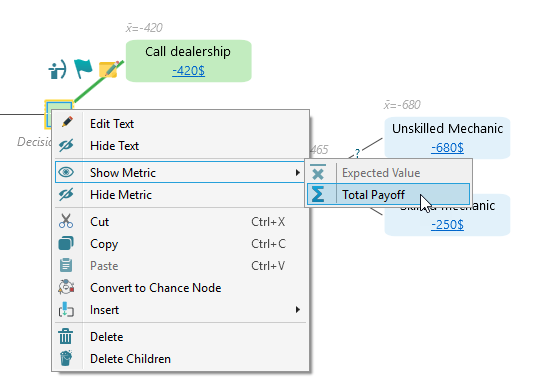
If you want to show or hide metric for a specific node, rather than all nodes, you can do that too. Just select a node and from the context menu of the SELECTED NODE, you will find options for showing or hiding metrics.
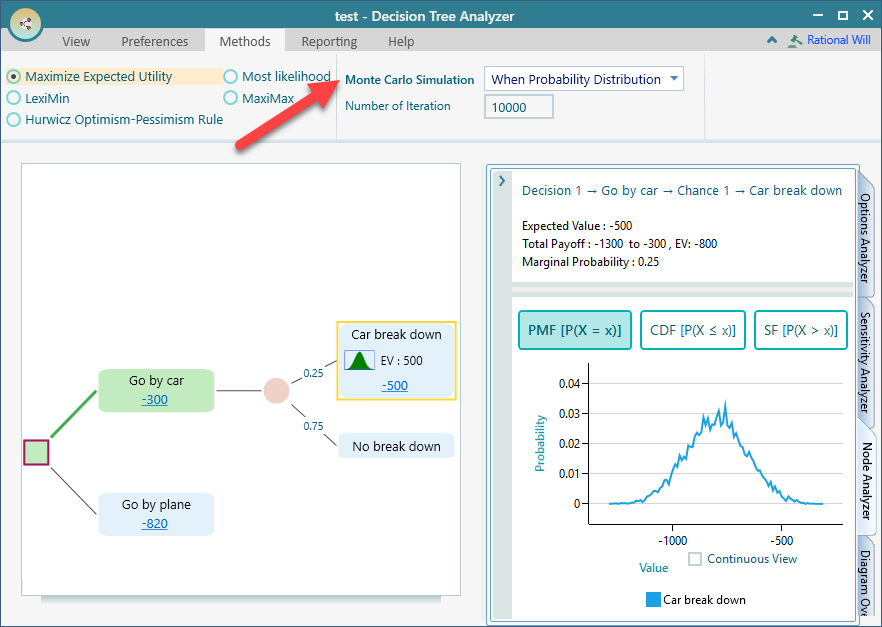
In addition, you can get a complete risk profile for that node by expanding the node analysis tab. For example, in the following decision tree, we can see the node analysis of the selected node "Go by car".
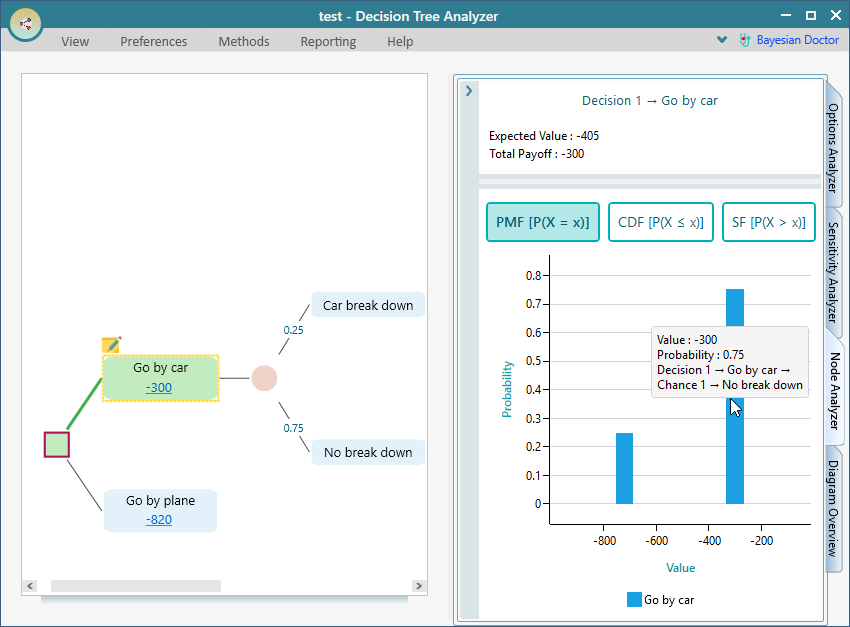
If you have a probability distribution in any selected node or children of a selected node, then a full Monte Carlo Simulation will be performed to generate the risk profile. Here is an example screenshot where we can see that the "Car break down" node has a Normal Distribution.