Various Risk Metrics
Decision Tree Software gives you a plethora of metrics for a decision tree. You can choose the metric you want to see in the Options analyzer carousel. Say, you have created the following decision tree.
Now, if you expand the Options Analyzer tab, you will see you can choose lots of metrics to display in the chart and the metric table.
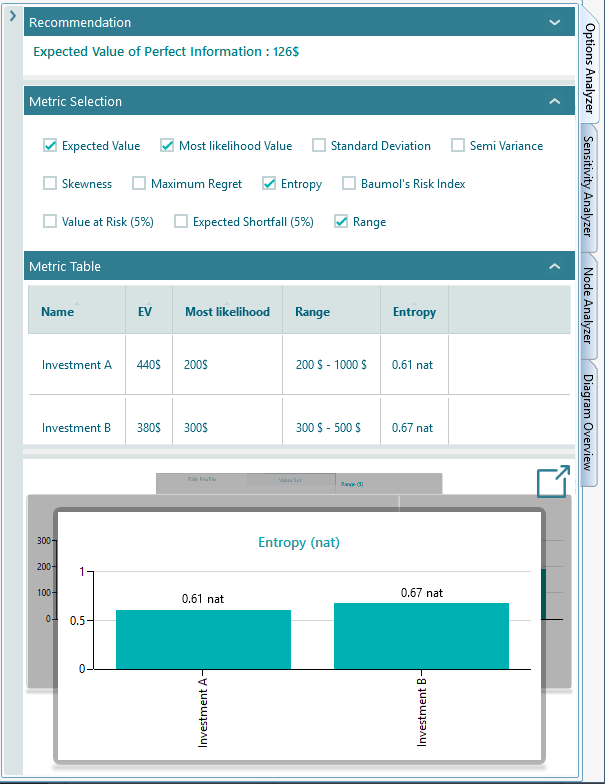
The metrics are made available based on the decision context. For example, if a decision tree does not contain any uncertainty (chance node) then uncertainty/risk-related metrics will not be visible in the Metric selection panel.
Usually, the following metrics are available to display in the metric table and charts carousel.
|
Expected Value
The expected value is the metric calculated by the following formula.
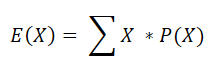
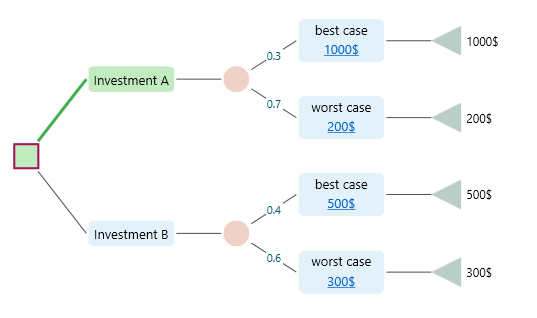
Where X is a Random variable that represents each outcome and P(X) is the probability of that outcome. For example, if you have the following decision tree,
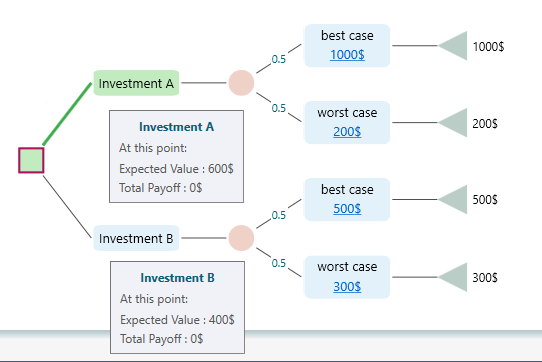
the Expected value of Investment A is EV = 0.5 * 1000$ + 0.5 * 200$ = 600$
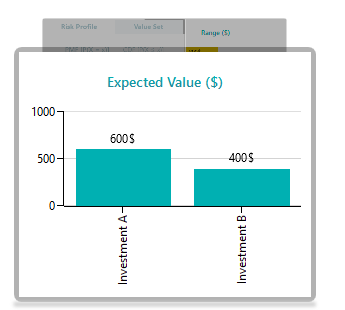
The expected value chart shows the metrics as shown below.

Most Likelihood Value
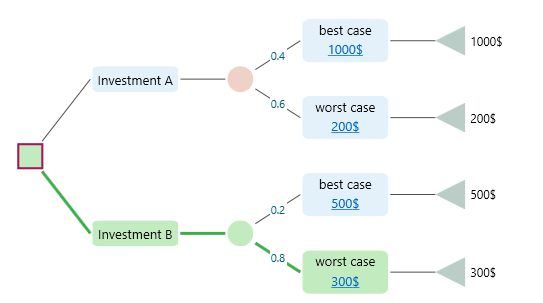
The most likelihood value is the value that has the highest probability to occur. In a decision tree as shown below, for Investment B, the most likely value is the Worst Case outcome because, in the chance node, the Worst case has the highest probability (0.8) among all events within that chance node.
Standard Deviation
A standard deviation is a measure that indicates how the values of an uncertain outcome are different. For example, in class A, if the students' exam scores are 50, 58, 55, 52, then we can say that their scores are very similar and variation is very low. On the other hand, in a class named class B, if the students' exam scores are 10, 100, 70, 40 then we can say there is very high variation among the scores. The average score of class B is 55. The average score of class A is 53.75. If we just compare the average, we will think that class A is doing better. But, looking into the score of class B, we can see that class B is actually consistent and all students are performing almost similarly. If the low variation is important for you, then only the average won't give you the correct picture. You need a metric that can tell you how the values are dispersed. Standard Deviation is the metric that can tell you that.
When the outcomes are uncertain, we call the outcome a Random variable. The standard deviation of random variable X is often written as σ or σx.
For a discrete random variable the standard deviation is calculated by the following formula:
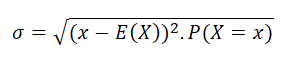
Here, x is a Random outcome, and P(X = x) is the probability of the random outcome x. E(X) is the expected value.
Semi-Variance
Semi-variance as a measure of risk is formally defined as:
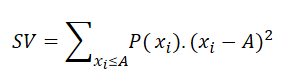
Where xi is a random outcome, P(xi) is the probability of the outcome xi. A is a threshold constant such that payoff less than A would be considered as a failure. For example, you might have an aspiration level for getting a certain salary when choosing a job. If a job pays less than a certain amount as a salary, you will not even think about that job offer. How to set your aspiration level in the Decision Tree software? You can open the Payoff popup and double-click the Criteria to open the objective editor.
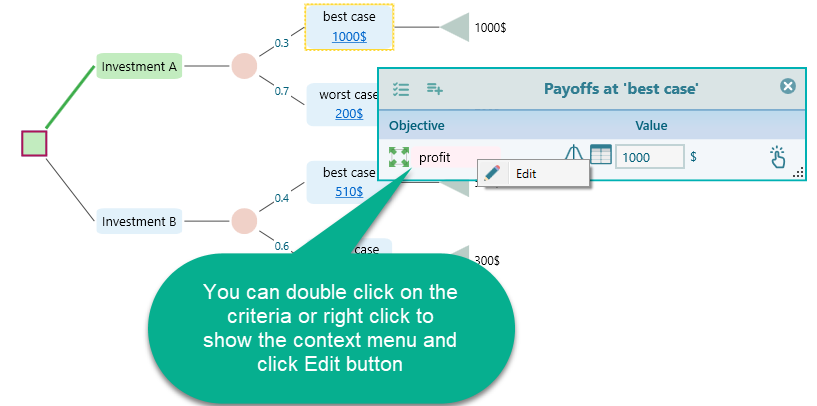
Once the objective editor is opened, you can set your aspiration level like this:
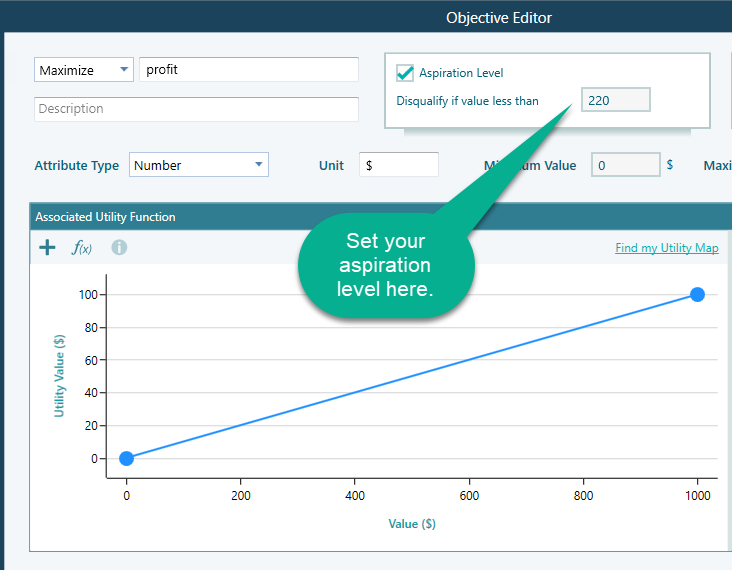
Please note that,
- The Aspiration level can be set only for the Number and Monetary type objectives.
- If the aspiration level is not set, then the Decision Tree software will consider the Expected Value to be the aspiration level and it will calculate the semi-variance using the Expected value as the aspiration level.
- If you have more than one objective, then naturally every objective may have its own aspiration level. Then, it is not meant to calculate a Semivariance based on any single aspiration level, right? Therefore, the decision tree software will use the Expected Value (or Expected Utility) to be the aspiration level and the semi-variance will be calculated based on that Expected value as the aspiration level.
Maximum Regret
Maximum regret is the metric that indicates, if you choose an option, at maximum how much you can regret by not choosing other options. It is discussed in detail on the Decision Criteria page.
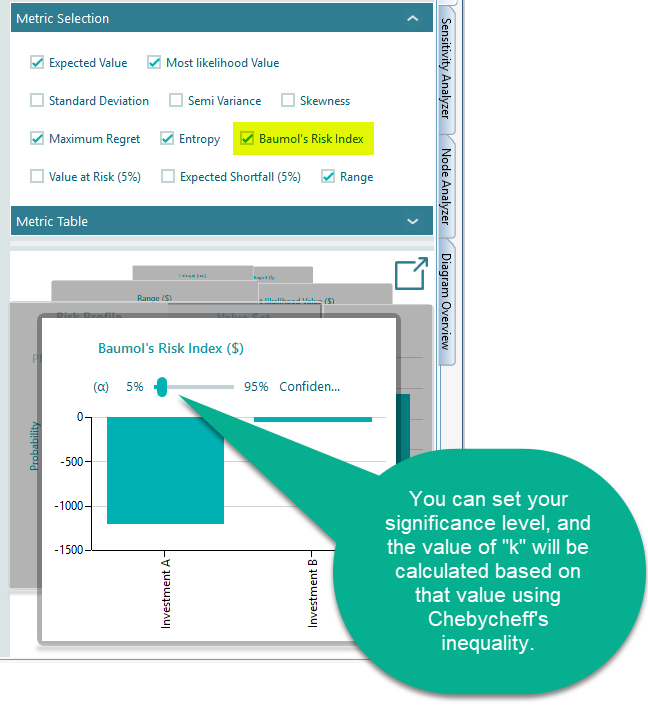
Baumol's Risk Measure
William Baumol purposes the following Risk Index:
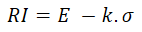
Where E is the Expected value, σ is the standard deviation, and k is some constant selected by the investor representing his/her safety requirement such that the return is unlikely to fall below it. In the decision tree software, the "k" is calculated from an input named "significance level". This significance level is the same concept used in the 'Value at Risk' calculation.
The probability of a payoff below E - k .σ is bounded by 1/k2.
Therefore, the value of k can be calculated based on the significance level. The software will ask your significance level α in the Carousel when you select Baumol's Risk measure metric.
Roy's safety first rule
According to A.D. Roy, investors are mainly concerned with avoiding the possibility of "disaster". Roy proposed that risk is measured in terms of the probability that the future outcome will be lower than a threshold (aspiration level) level. Roy's risk index is defined as follows:
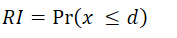
Where 'd' is the aspiration level? In the section on the "Semi Variance" metric, we have explained how to set the aspiration level for an objective.
Once you set the aspiration level, you will see the metric "Roy's safety first rule" available in the metrics panel.
Entropy
When you watch a movie, if you can predict the sequence of events, then you do not feel any suspense and eventually, do not enjoy the movie, right? How do you measure the suspense of a movie? You will say, the less you can predict, the more suspense you will feel. Right?
That is the idea of Entropy. Entropy is a metric that measures how little you can predict from random variable outcomes. "Probability" measures how likely one uncertain state can occur. And Entropy measures the degree of uncertainties in a Random variable. In another word, it measures the level of surprise. A Uniform Probability Distribution has the highest entropy because every possible outcome in that distribution has an equal chance to happen so you will always be in suspense with a uniform probability distribution. But what about a Normal Distribution? Using a normal distribution, outcomes are highly predictable around the Mean, so a Normal Probability distribution has lower entropy than a uniform probability distribution.
Named after Boltzmann's Η-theorem, Shannon defined the entropy Η of a discrete random variable X as
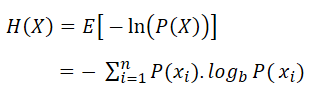
Where b is the base of the logarithm used. In the Decision Tree Software, you can change the base as "e", "2" or "10" by changing the unit as nat, Shannon, or Hart.
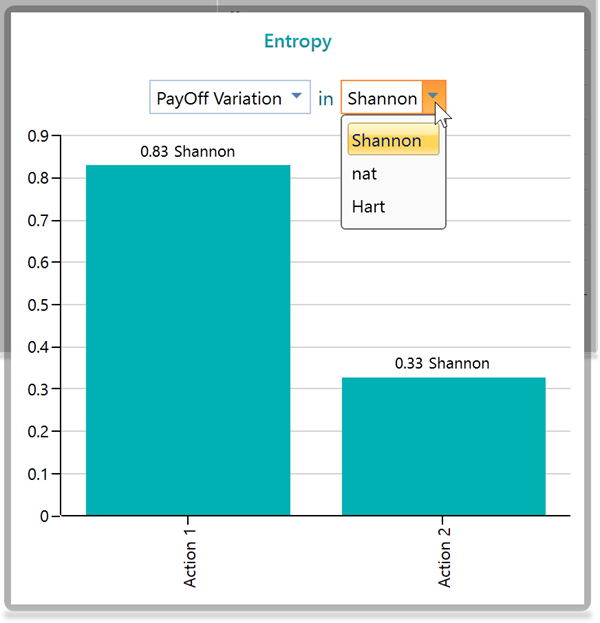
There is a dropdown you can see in the Entropy Chart panel.
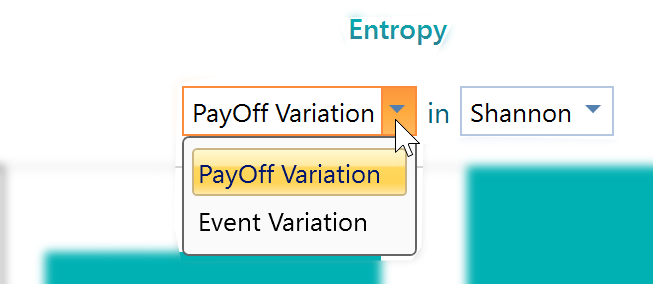
What do these options mean? Ok, think about the following decision tree,
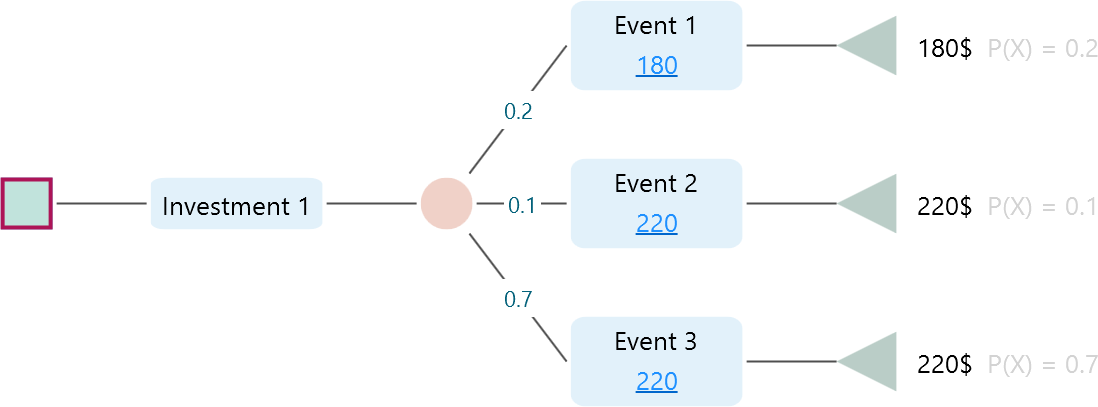
In this tree, We see that, for Investment 1, there is a total of 3 events, where two of them give you the same outcome, 220$. So, if you are concerned about the actual revenue outcome, then you have basically two uncertainties, 180$ or 220$, not 3. Right? Therefore, if you select "Payoff Variation", then the software will group the events based on final outcome and consider an event different from another if the final outcome is different. As we see, there are basically two events, 180$ event and 220$, based on final outcome. So, the entropy will be calculated, based on this fact. But, say, you do not worry about the final outcome, rather, you are concerned, about how many events can occur, then, there are 3 events. You can select the option "Event variation". You will see the software will calculate entropy based on considering 3 outcomes.
Let's see the calculation result in the Entropy panel.
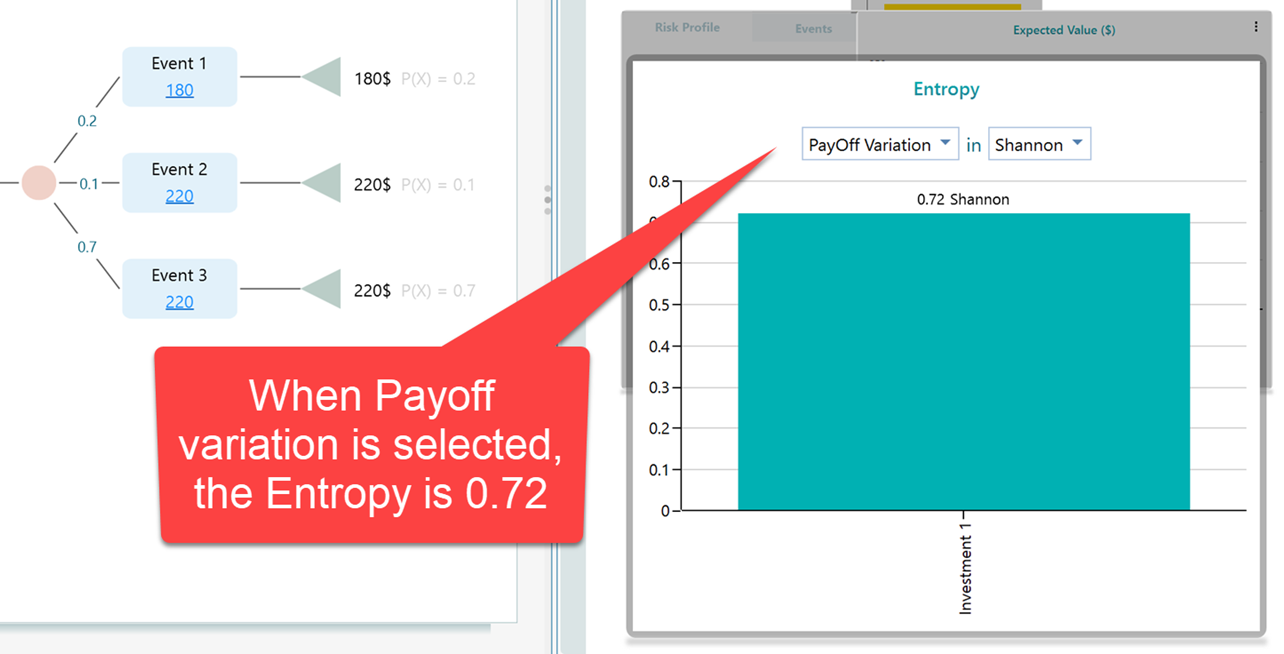
When there are two outcomes, (based on payoff variation), the entropy is calculated as 0.72 Shanon.
Now, let's change the dropdown selection to Event variation.
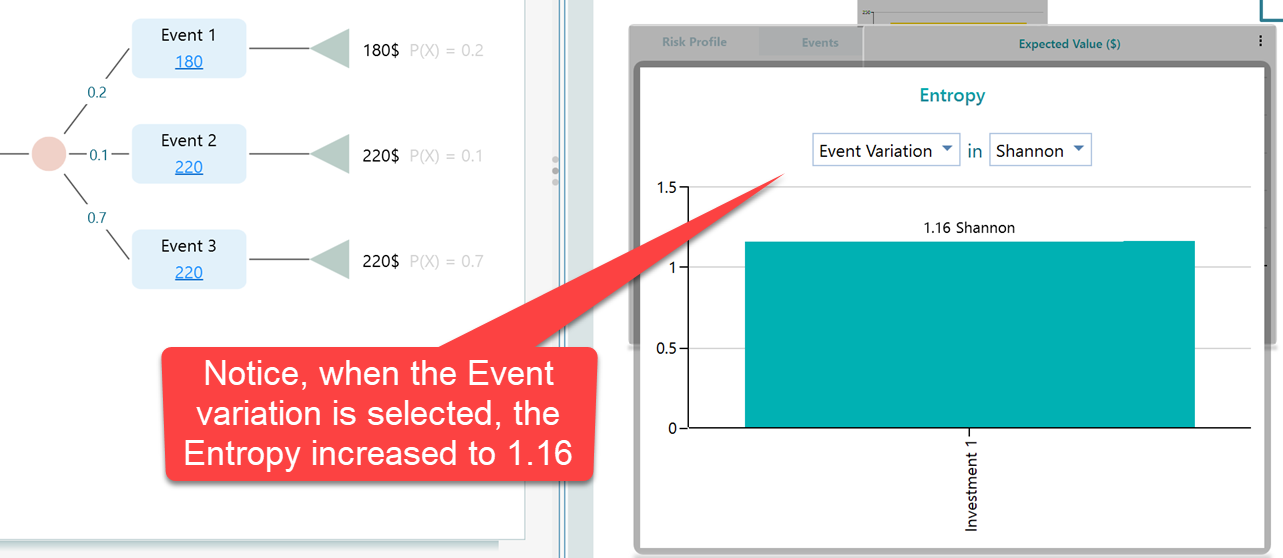
So, it makes sense, right? When you considered only 2 outcomes, you had higher predictability. You knew the outcome will be either 180$ or 220$. So, you had less suspense compared to when you had to worry about 3 outcomes. When using "Event Variation", the number of outcomes is considered based on the name of the event, not the final payoff. So, naturally, you will be in more suspense if you consider 3 outcomes rather than 2 outcomes.
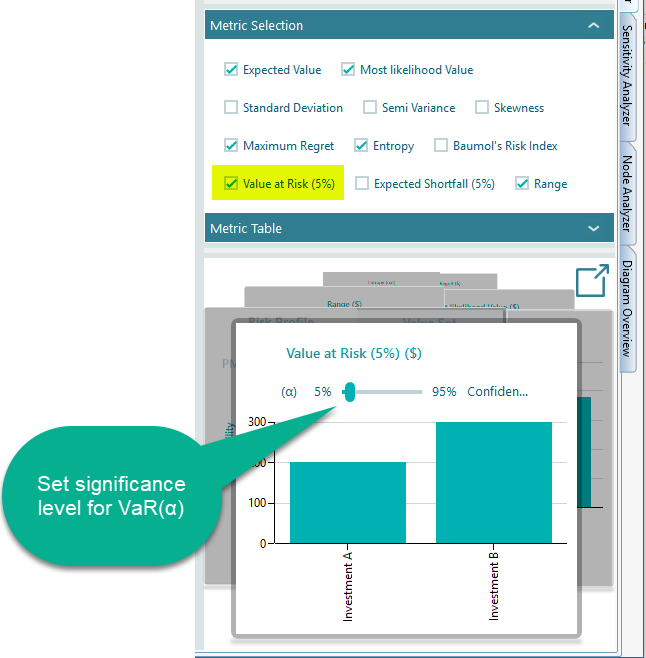
Value at Risk
Value at Risk expressed as VaR(α) is a common risk index used by practitioners and in particular by financial institutions. It is defined as the maximum dollar amount expected to be lost at a pre-defined confidence level. In the Decision Tree software, you can choose to display the Value at Risk metric from the metrics panel. Then the chart in the carousel will let you set a level of confidence or significance level (α) as shown below.
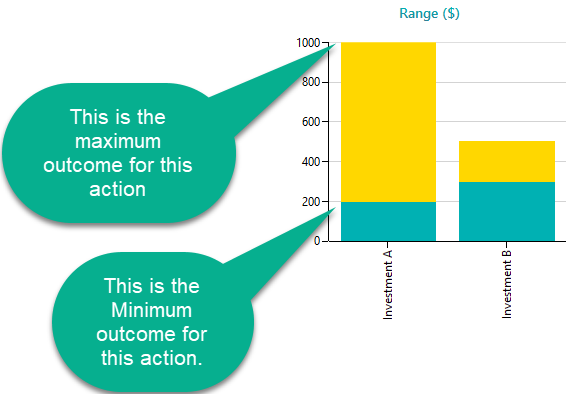
Range Chart
A Range chart shows the Minimum Possible value and the Maximum Possible value of an option as a range. Looking at the range chart, a decision maker can quickly understand the risks and expectations, and then he/she can choose an option based on Maximin/Leximin criterion. The Range chart also helps the decision maker to understand the dominance among options. Which option dominates another option either deterministically or stochastically.