Sensitivity Analysis
What is Sensitivity Analysis?
When you are in a stressful situation because nothing is going your way, you would care less about things that do not change your situation to many degrees, Right? So, you want to focus on the variables that actually driving the situation in more significance. Finding those variables is actually the "Sensitivity Analysis". In a decision context, there are lots of variables like the probability of an uncertainty, outcome of uncertainty, payoff at some node, etc. In a sensitivity analysis, we change the variables from some minimum reasonable value to a maximum reasonable value and see at what point the decision changes. We observe the amount of change required to that variable to alter the final decision. The minimum alteration required to change the decision, the more sensitive the variable is.
An Example of a Dilemma and a Decision
Say, you just received a job offer and you are in a dilemma should you take the offer or wait for a better offer. If you wait for a better offer, then there is a possibility that you will stay jobless for a long time or you will get a better offer soon. If you stay jobless for a long time, your mental health can be ruined by stress, and needless to say that financially you may be in a difficult situation. But if you get a better offer, you will be very happy and financially very sound. So, what should you do? Say, your job offer at hand will pay you 90,000$/year. But, you are expecting that a better offer may come with 150,000$/year. Let's make the decision tree for this situation. You initially assumed that there is a 70% chance of getting a better offer and a 30% chance of staying jobless for a long time.
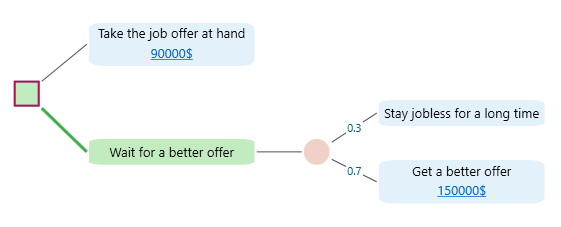
By looking into the above decision tree, surely you can calculate the Expected Value of both actions and found that the Expected Value for "Wait for a better offer" is 105,000$, which is higher than the payoff of "Take the job offer at hand". So you decided to wait for a better offer.
Robustness of a Decision
Okay, you have taken a decision based on the maximum expected value. But what if the parameters you have used here are not correct. For example, your next job offer may not pay you 150,000$. It can be less. Or what about the probability you assumed that 70% chance that you will get a better offer. What if the probability of getting a better offer is actually lower than you assumed. If any of those parameters change, your decision (which is based on maximizing the Expected value) won't be the same, right? So, you need to understand, that even if the parameters are changed a bit, will your decision will stay the same? If so, you can think that your decision is a robust decision. Otherwise, you will need to focus on making a better estimate of those variables. For example, do market research to get a more accurate probability of getting a better offer. Also, you may need market research to understand what can be the highest possible salary based on your skill and experience. The question is, which variables you should study now with more attention than another. A Sensitivity Analysis will give you a list of variables with the degree of sensitivity (let's call it, a sensitivity index).
Sensitivity Analysis in Decision Tree Software
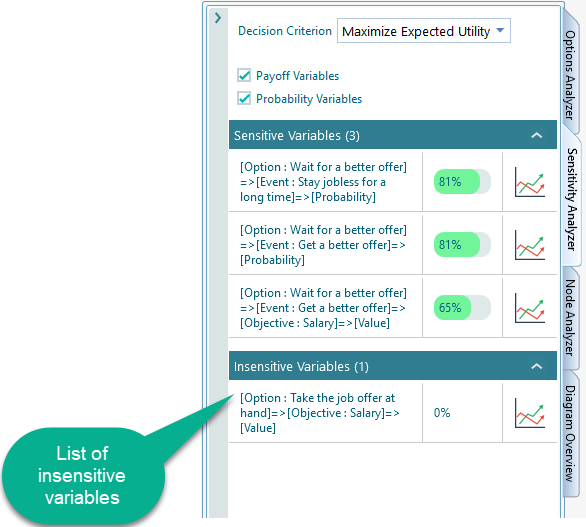
Once you model the decision tree for the above-mentioned job offer dilemma in the Decision Tree Software, you will be able to see the list of variables with their sensitivity in the Sensitivity Analyzer tab as shown below.
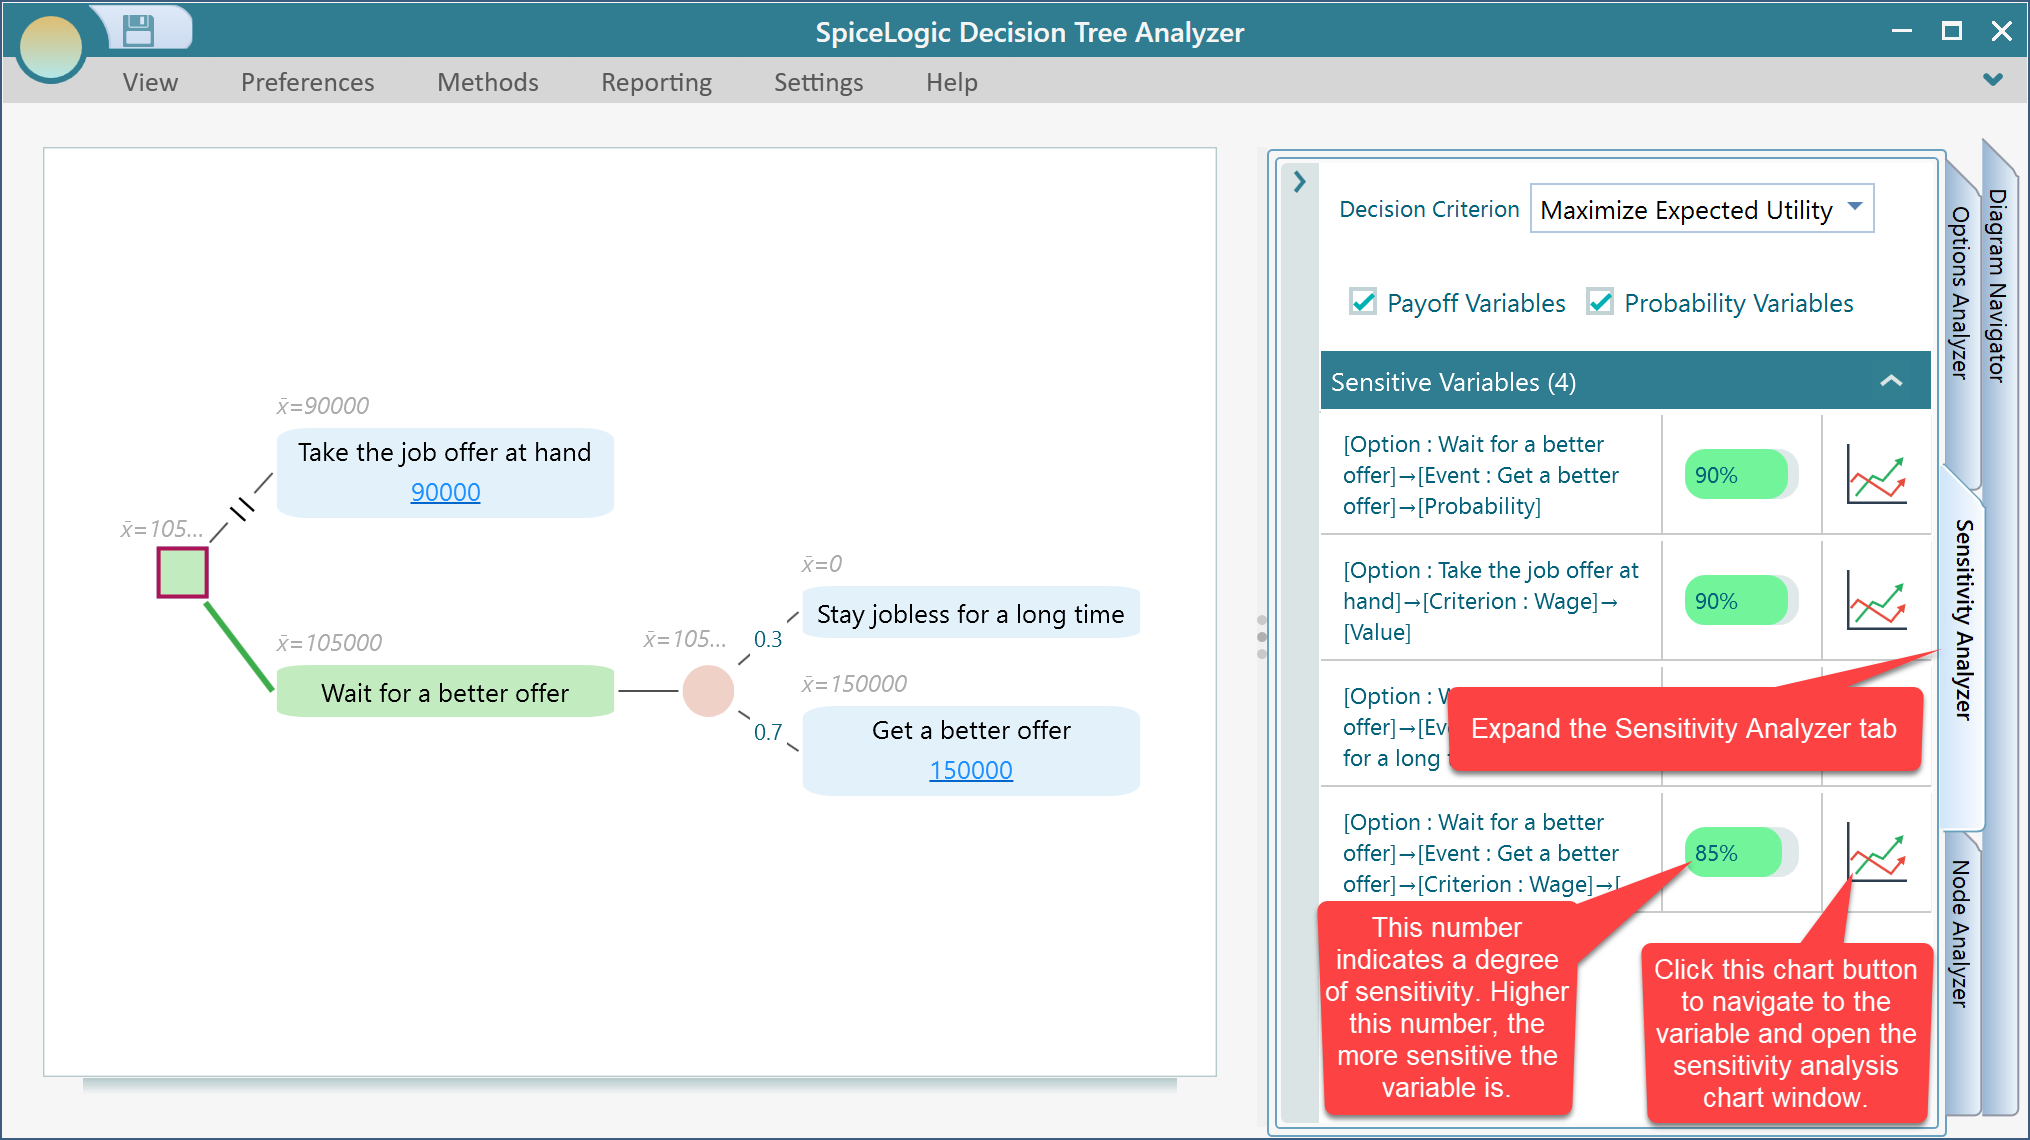
If you notice the sensitivity analysis panel, you see that the highest sensitivity variable in this decision context is the "Probability that you will get a better offer - If you wait". The sensitivity index is shown as 90%. That means, in this decision context, the key factor in this decision-making is the probability that you will get a better offer. So, think twice. Are you very confident that 70% chance of getting a better offer? Maybe you need to check the market status and see how the jobs are moving. Because, if your probability of getting a better offer is lower than 70%, maybe you should take the job offer at hand.
You can use the built-in Bayesian Inference tool to perform some experiments, observe the result, and update your belief accordingly.
Using sensitivity analysis, we have learned that any decision should be concluded with a sensitivity analysis to verify that your inputs are solid and you are confident about the decision you make.
What does the sensitivity index mean? Let's explain how we calculate the Sensitivity Index.
Sensitivity Index Explained
Once you see the sensitivity analyzer with a list of variables, click any of the variable's chart buttons as shown below.
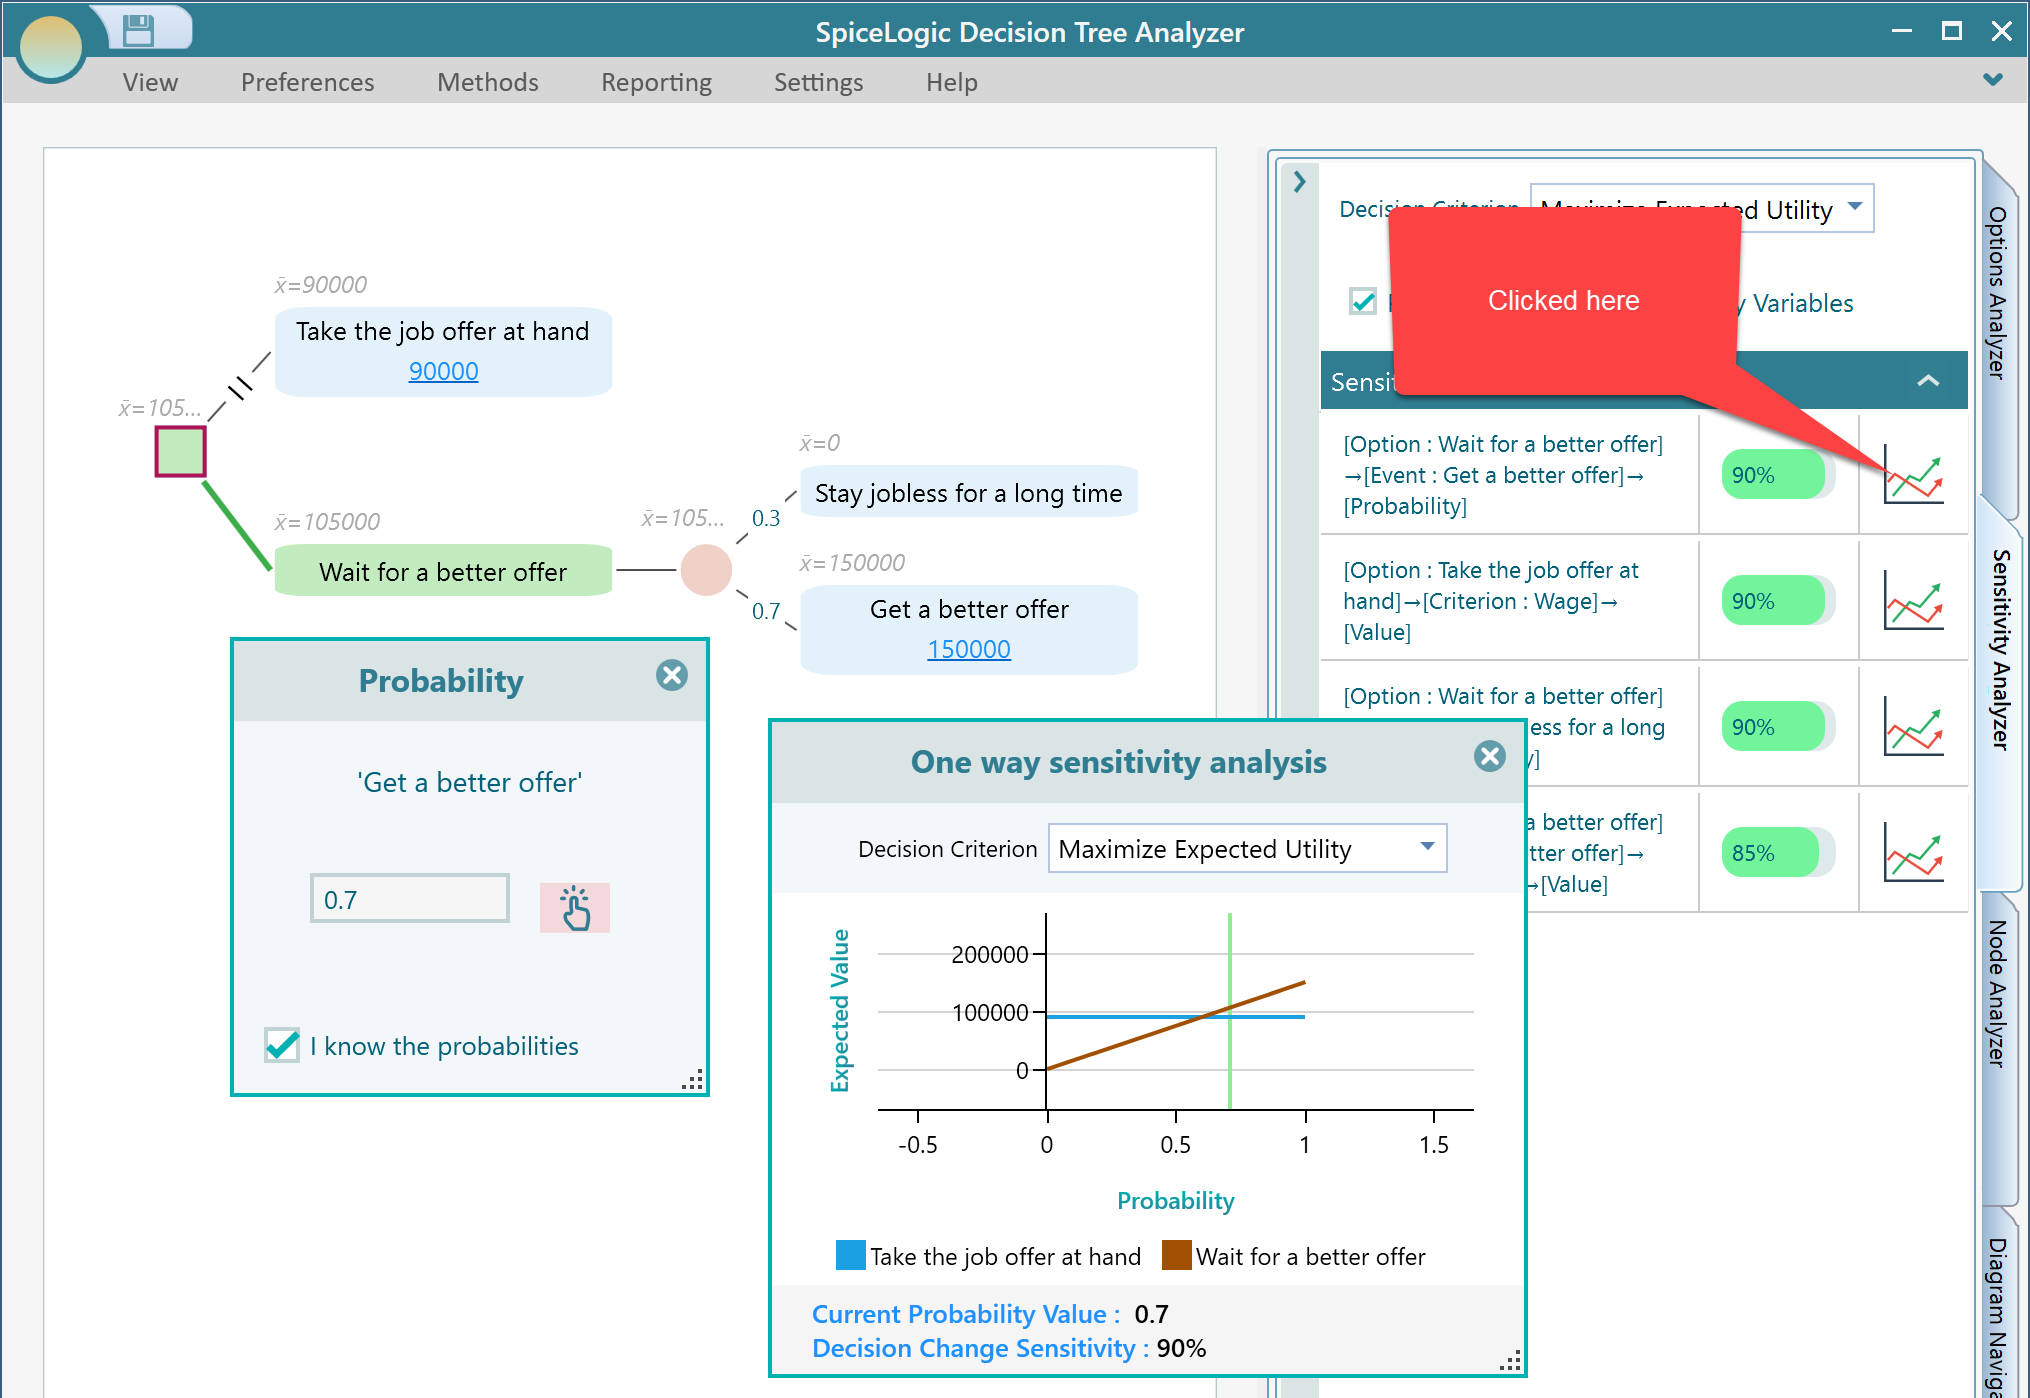
That means, whenever you click on the Chart button from the sensitivity analysis panel, the corresponding User Interface is displayed and the Sensitivity Chart for that variable is opened up.
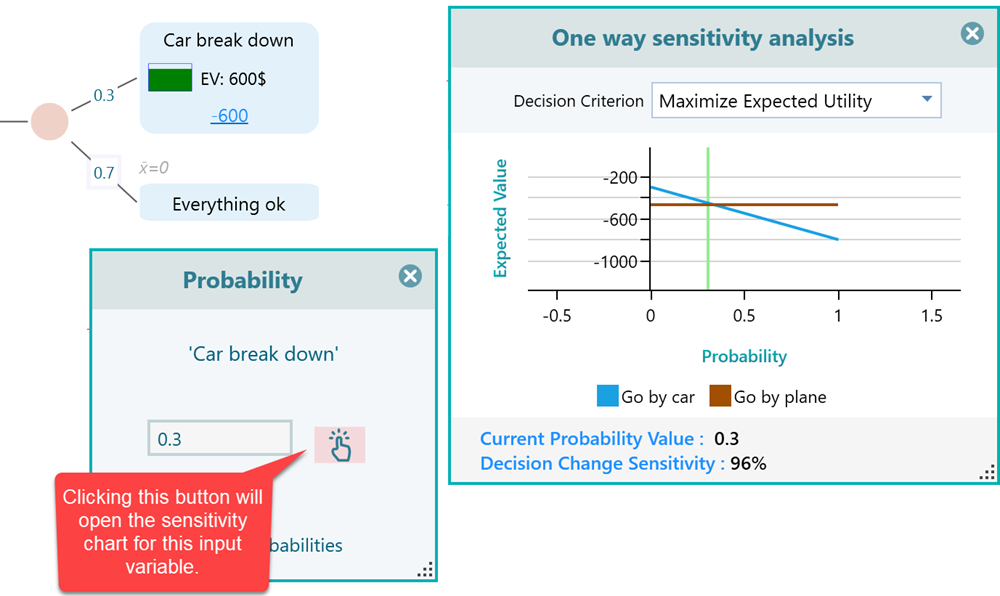
The sensitivity chart displays a chart of the Expected Value of the two options on the Y-axis and the value of the variable in interest on the X-axis, ranging from the minimum possible value to the maximum possible value., which changes with the change of the variable changes from the minimum possible number to the maximum possible number.
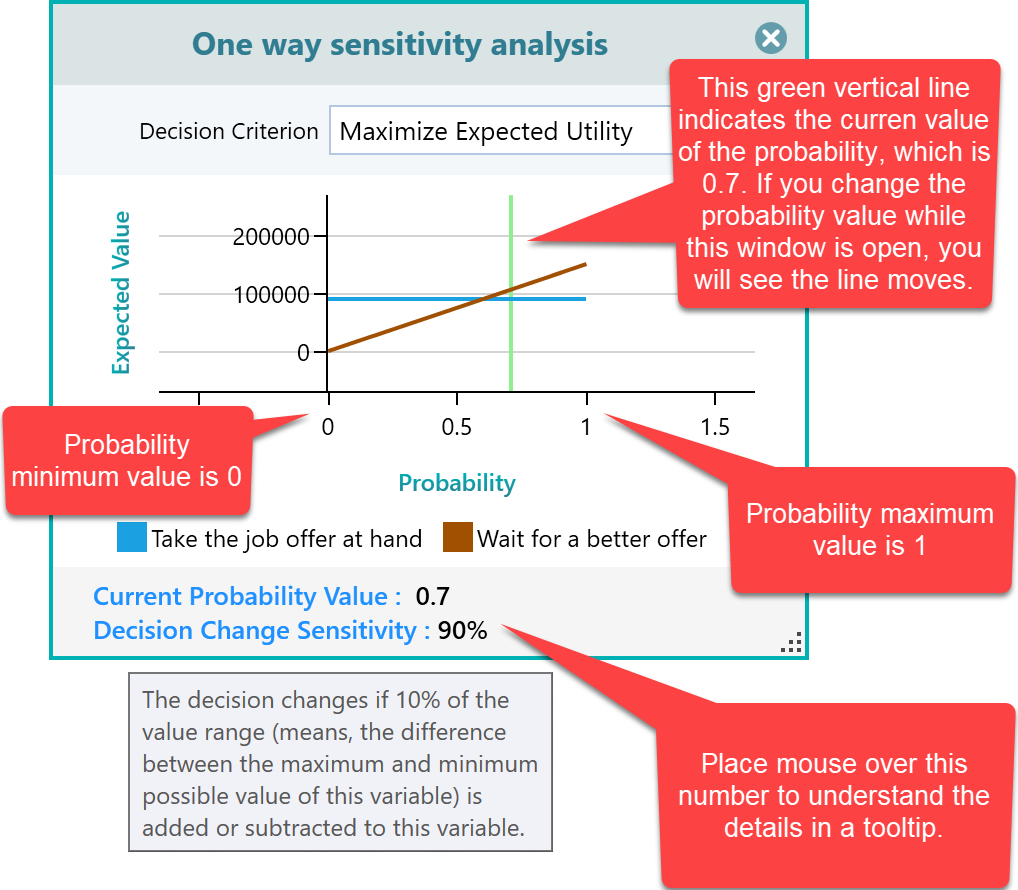
Ok, so, from where the Sensitivity Metric 90% has come from? On the tooltip, you see the message that "The decision changes if 10% of the value range is added or subtracted to this variable. The software ran a calculation and found that, when the probability of 0.1 is changed from the current probability (which is 0.7), then the decision changes to "Take the job offer at hand". 0.1 is 10% of the whole probability value range (0 to 1). The software calculates the sensitivity index using the following formula:
Sensitivity Index = 100 - Percentage of Change required in the current value of the variable to alter the decision.
Therefore, here, it is = 100 - 10% = 90%.
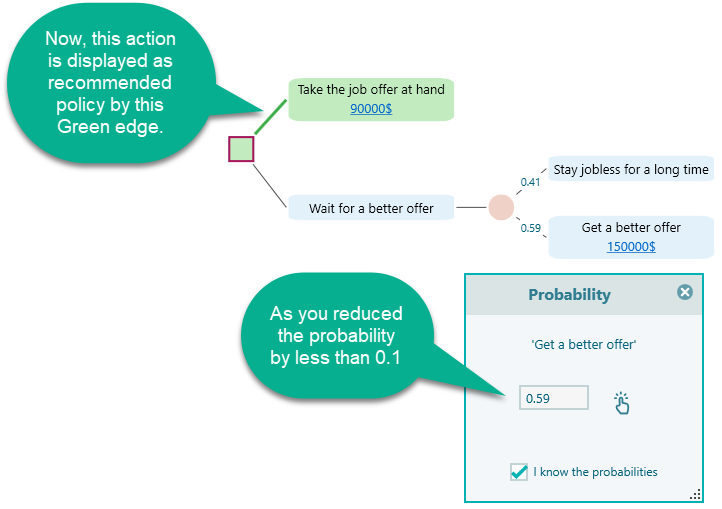
Let's verify the concept by yourself. Change the Probability value of the "Wait for a better offer" to 0.6 (0.7 - 0.1), and you will notice that both of the actions have equal expected values, therefore, no specific actions will be highlighted as a recommended policy. Now, reduce the probability just by 0.01 more (i.e. 0.59) and notice that the Action "Take the job offer at hand" is now shown as the Highlighted edge (Green colored edge means the recommended policy).
Why did we use such a formula? Because, we wanted to mean that, the more is the sensitivity index number, the more sensitive the variable is. If a high percentage of change is required to alter a decision, the variable is very less sensitive. If a very little percentage of change to the variable alters the decision, then the variable is highly sensitive. So, also we wanted to use the percentage as the unit of this index. Therefore, 100 - X where X means "the percentage of change required to alter the decision" makes sense. If the percentage of change required is 0, then it will mean that the variable is extremely sensitive and ANY change to the variable value will alter the decision. So, the index will be 100 - 0% = 100%. If the percentage of change required to alter a decision is 100% or close to 100%, according to the formula, the sensitivity index will be 0%. That makes sense, because if a variable needs to be changed a lot to alter a decision, then that variable is a very insignificant factor to that decision, which we can call an insensitive variable. The sensitivity analyzer panel shows the list of insensitive variables separately for a better view.
Sensitivity is calculated based on a Decision Criterion
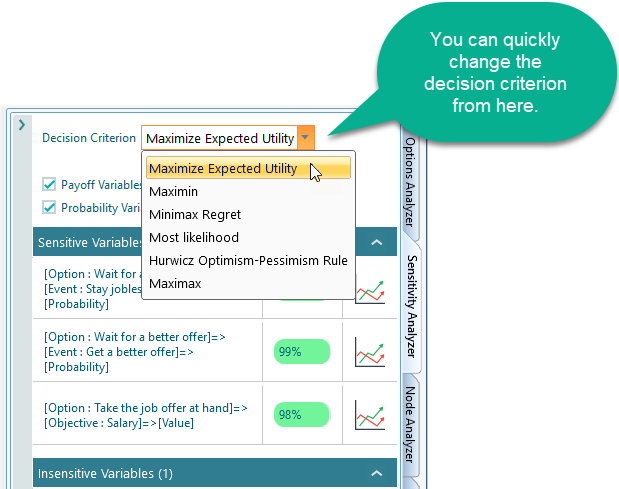
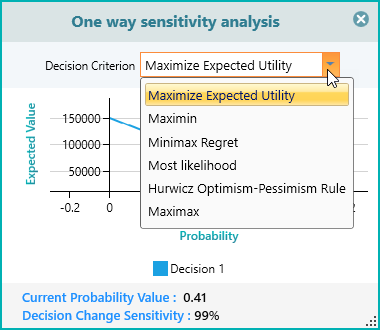
So far, we have calculated the sensitivity index based on the Expected Value of the outcome. What if you are not concerned about the Expected Value, rather, you want to minimize the maximum regret (Minimax Regret Criterion) or what if you are very pessimist and you want to evaluate an action-outcome based on the worst-case scenario (Maximin Criterion). Yes, you can select the decision criterion from the sensitivity analysis panel as shown below.
Once you have the Sensitivity chart open, you can change the decision criterion from there too.
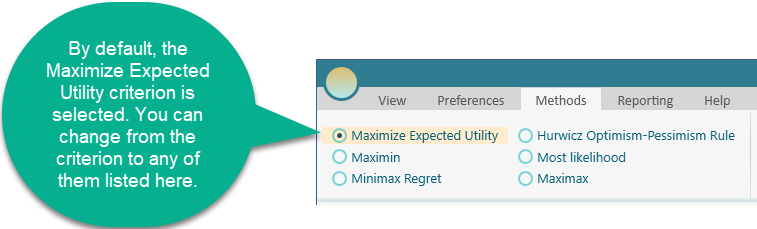
Needless to mention, you can always change the decision criterion from the Ribbon's Method tab as shown below.
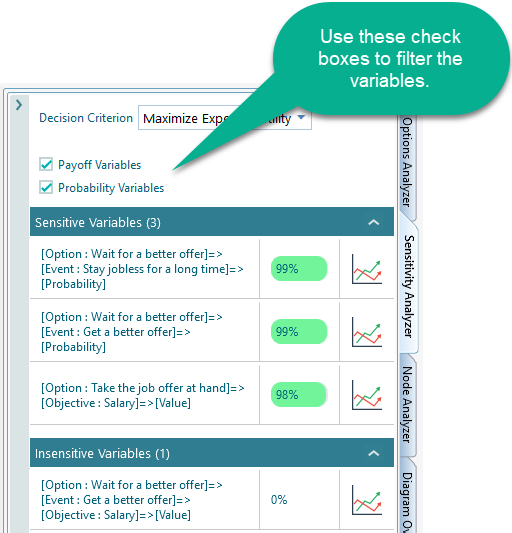
Filtering variables for focused analysis
At times, you may want to understand the sensitivity of a specific type of variable, like Probability variables or Payoff variables. You can filter out the variables as you like by checking these checkboxes.
Check the Sensitivity of Any variable
You do not need to open the Sensitivity Analyzer panel to look for a variable all the time. Rather, when you are at any user interface section, you will find a hand button as shown below. Clicking that hand button will open up the Sensitivity Analysis chart for that corresponding user input variable. Please note that this button may not show up if you do not have more than one action or when the decision tree is in such a state that there is no question of choosing between actions.