Custom Continuous Distribution
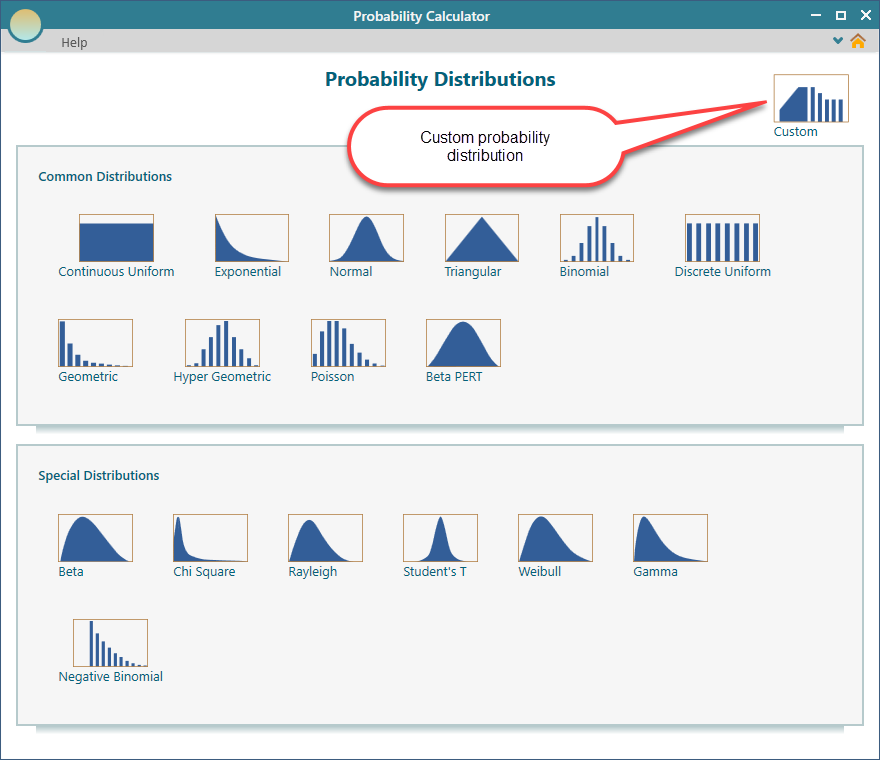
There are many commonly used Probability Distributions available in the gallery, yet, you may like to create a distribution of your own. Therefore, Custom distribution is available for you to model any probability distribution you want using expressions of "x". Also, you can create a distribution providing a data table, where the table represents a set of data points that connect and form lines.
From the dashboard, chose the 'Custom' button to start.
Using Piecewise Expressions
You can use piecewise expressions for modeling a custom probability distribution. In this chapter, we are demonstrating the functionalities of a continuous-type distribution.
Select the piecewise option as shown below.
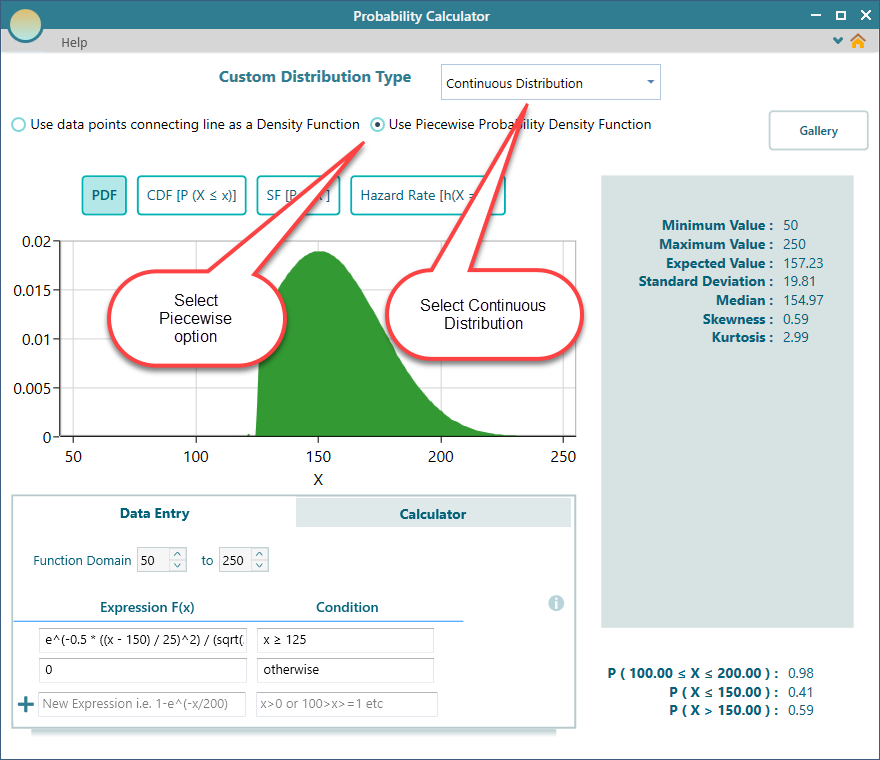
Notice the Data Entry tab in the above screenshot. You can easily understand that you can enter an expression using the variable 'x'. Every line represents an expression for a given condition. It is not necessary to have a condition for a single line expression, so you can leave that condition box blank. But, if you have multiline expressions, then, of course, you will need to set condition, otherwise, it won't make sense, right?
The expression you see in the above screenshot, means,
The density function of the custom distribution is

The expression editor supports many possibilities. You can learn more about the Expression editor Custom Expression Editor.
Function Domain
When you define a piecewise function expressions, you need to define the domain of the function. That means the Minimum value and the Maximum value of the Probability Density Function needs to be set.

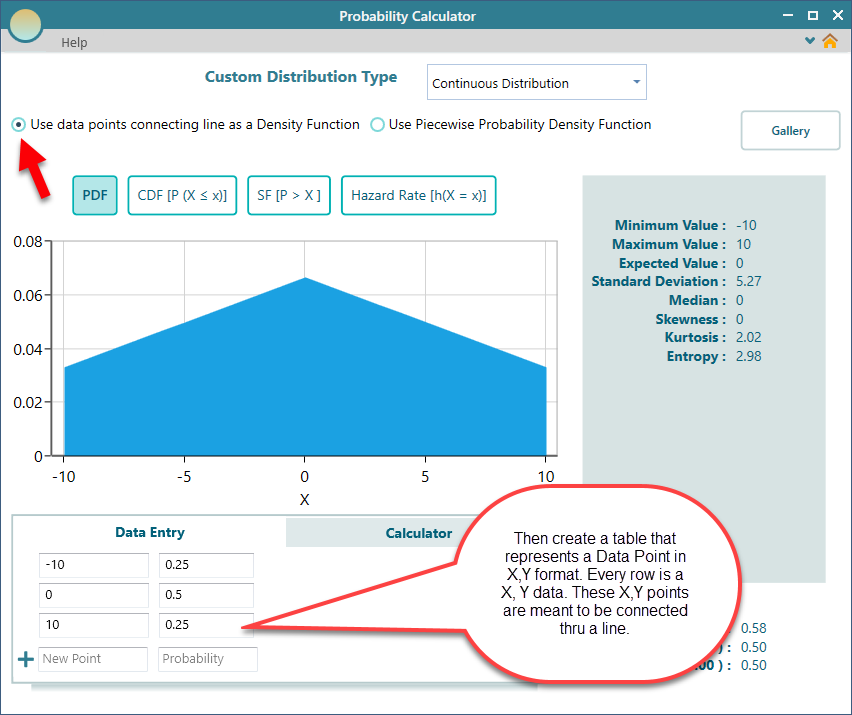
Using Data Points Table
It may be quick and easy to define a distribution by specifying a set of data points that are meant to be connected by a line. Select the 'Use data points...' option as shown below:
Scaling
No matter how you define your custom distribution function, either using point table or f(x) expression, the area under the Probability Density Function curve must be equal to 1 for an ideal probability distribution. Therefore, the Probability distribution app will always scale your PDF function so that,
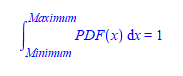
The probability distribution properties, and calculated values, all will be based on the scaled function, rather than your raw function.