


Custom Utility Function Equation
On another page we showed how to model a utility function by plotting a few points on a map. That works well most of the time. You pick a handful of values, give each one a utility, and the software draws a smooth curve through them.
Sometimes you already know the exact shape of your utility curve as a math formula. In that case you may rather type it in than place points by hand. Maybe a colleague gave you the equation. Maybe you read it in a paper. Or maybe you just like the precision of a formula. The software lets you do that. Instead of a point map, you can define your utility function with your own custom expression.
Here is a quick example. Say you are valuing money, and you believe each extra dollar means a little less to you than the one before it. That is the usual idea behind risk aversion. The first $5,000 feels like a big deal. The jump from $50,000 to $55,000 feels smaller, even though the amount is the same. A point map can get close to that shape, but you might rather write the curve directly, such as 1 - exp(-x / 5000), and have the software use that exact equation everywhere.
To get started, open the Objective Editor for a Number type objective. You will see the following buttons.
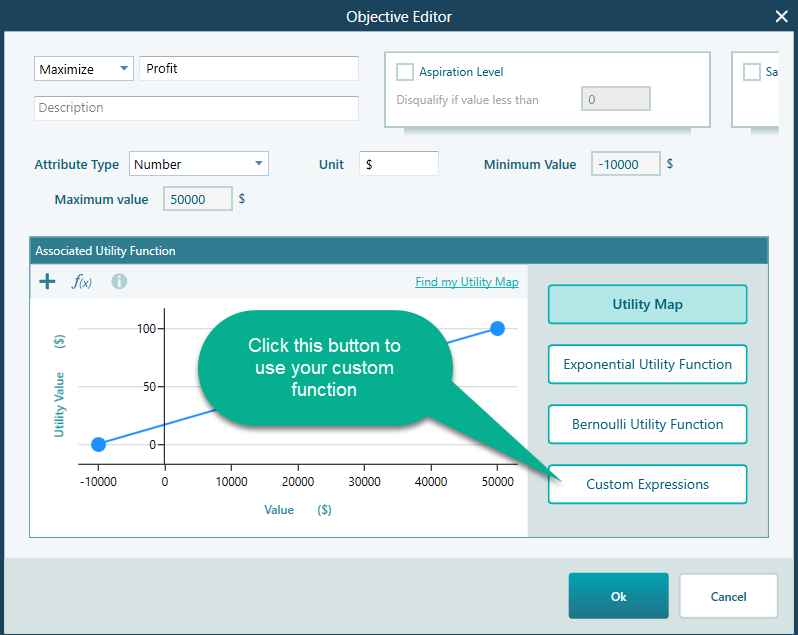
Click the Custom Expressions button. The view below opens. This is where you type your formula.
Here you write the equation for your utility function. The variable x stands for the value of the objective. So the expression tells the software how much utility you get for any given value of that objective. For example, if your objective is dollars earned, then x is the dollar amount, and the formula returns the utility for that amount. As you type, the software reads the expression and uses it as your utility function right away.
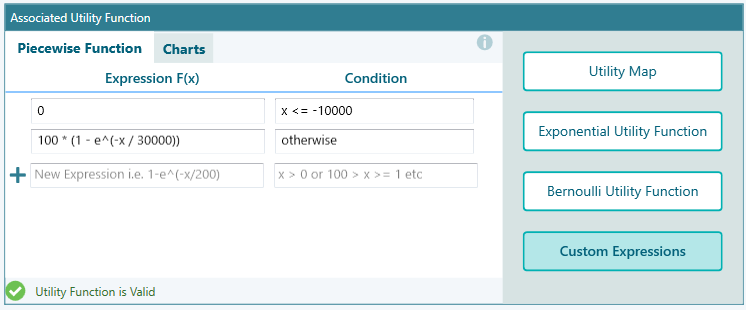
You can edit the expression however you like. Change the numbers, swap in a different formula, or rework it until the curve matches how you really feel about the values.
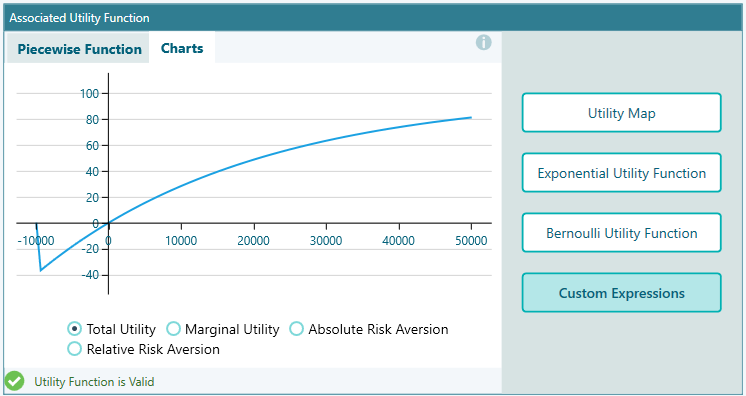
It helps to see the result, not just the text. Click the Charts tab to view the curve your expression produces. The chart updates from your formula, so you can check the shape at a glance. Is it rising the way you expected? Does it flatten out where it should? Does it bend the right way? If something looks off, go back, adjust the expression, and check the chart again. For example, if the curve climbs in a straight line when you wanted it to level off, you can lower the divisor in the formula and watch the top of the curve start to bend. A few quick passes like this usually get you to a curve you trust.
You can write more than a plain formula here. The editor supports a range of built-in math functions, so you can build the exact curve you need. For the full list of functions and more detail on how to write custom expressions, see this dedicated documentation page.