Getting Started: Predicting health state
In this example, we will model a very simple Markov Chain of a Patient that transitions from a "Well" state to a "Post-Stroke" state and "Dead" state. We will use a Transition probability such that,
State "Well" to state "Well" => Probability 0.9
State "Well" to state "Post-stroke" => Probabilty 0.2
State "Well" to state "Dead" => Probability 0.1
Then, from the state "Post-stroke" to state "Dead" => Probability 0.1
and from the state "Post-stroke" to "post-stroke"=> Probability 0.9
And finally the state "Dead" is an absorbing state. That means, that if the patient enters into the "Dead" state, then he/she cannot exit that state.
Ok, let's create the model. Start the SpiceLogic Markov Chain Calculator software.
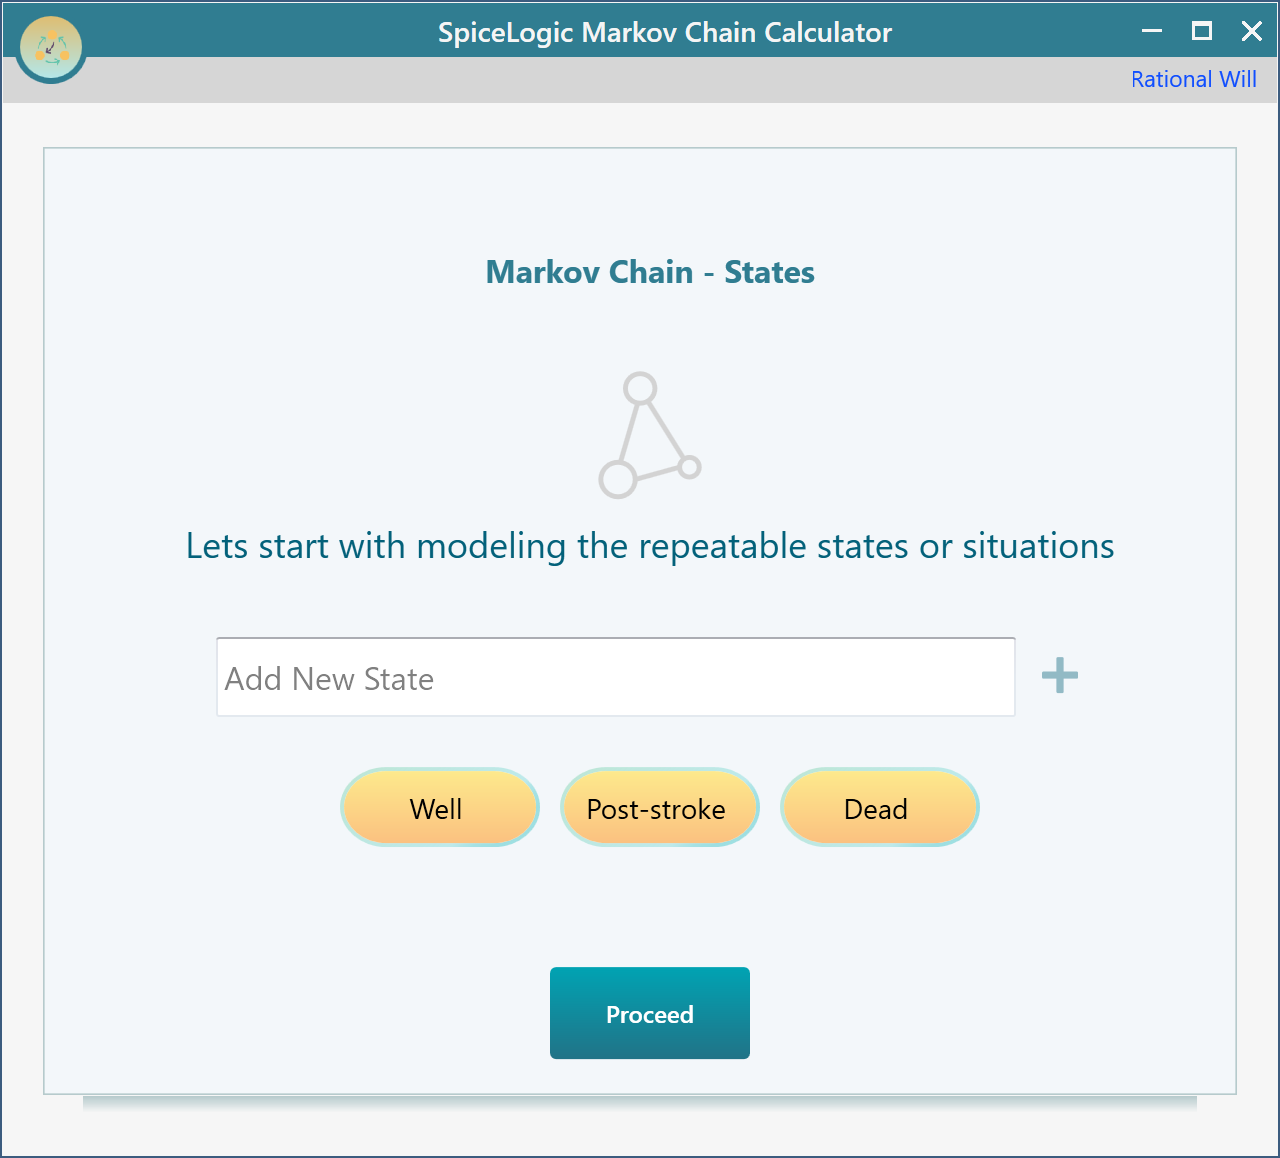
On the first screen, you will be asked to enter the name of the states. Enter the name of the states as shown below.
Setting Transition Probabilities
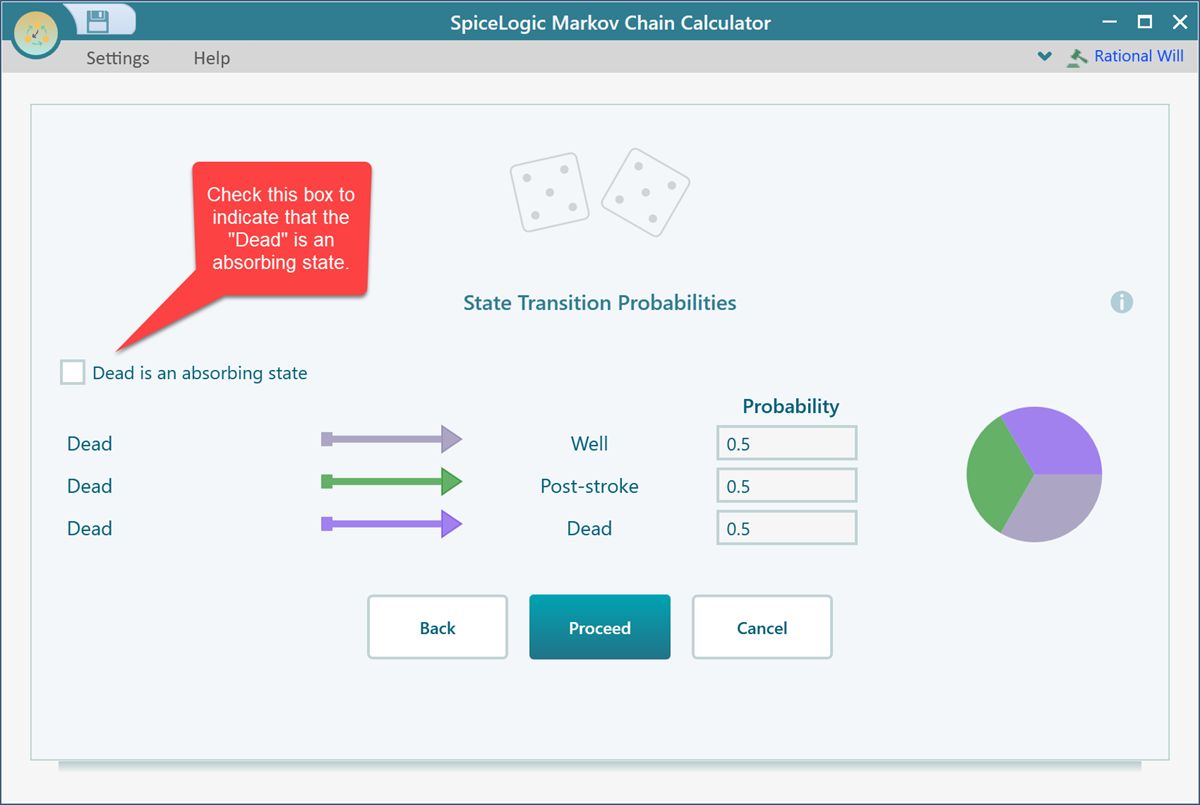
Click the Proceed button and you will be asked to set the transition probabilities for the state "Well". Set the probabilities as shown below.
![]()
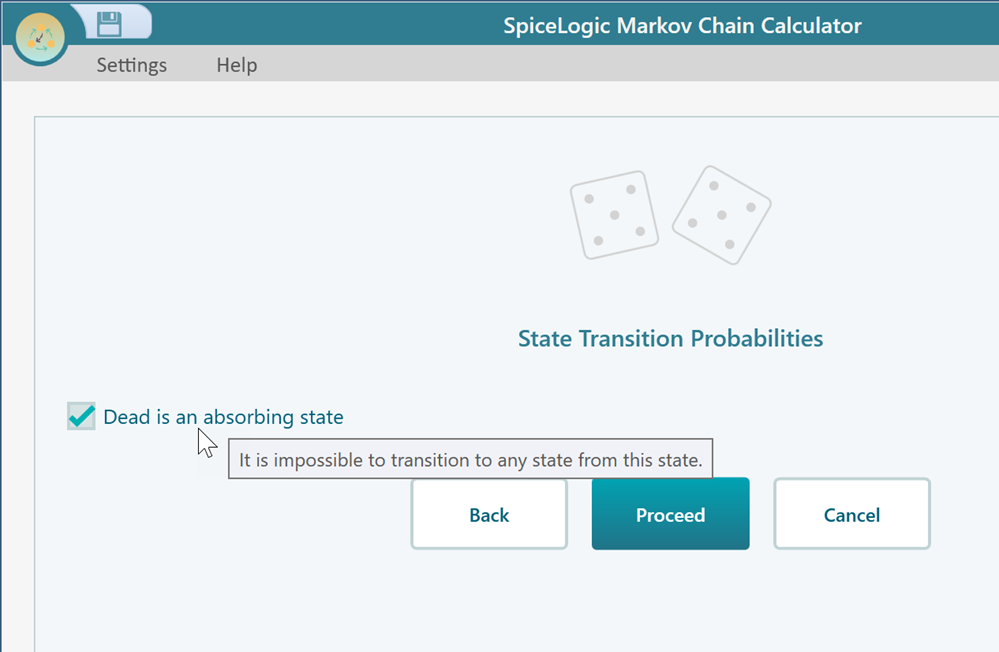
Click Proceed and you will be asked to set the transition probabilities for the state "Post-stroke". Set the transition probabilities for "Post-Stroke" in the same way as shown above. Then click Proceed. Now, you will be asked to set the transition probabilities for the state "Dead". You will see that there is a checkbox that can be checked to indicate that the state is an absorbing state.
Once you check that box, click Proceed and finally you will be presented to a screen saying you have completed configuring the Markov chain. Click the "Finish" button and you will be taken to this view.
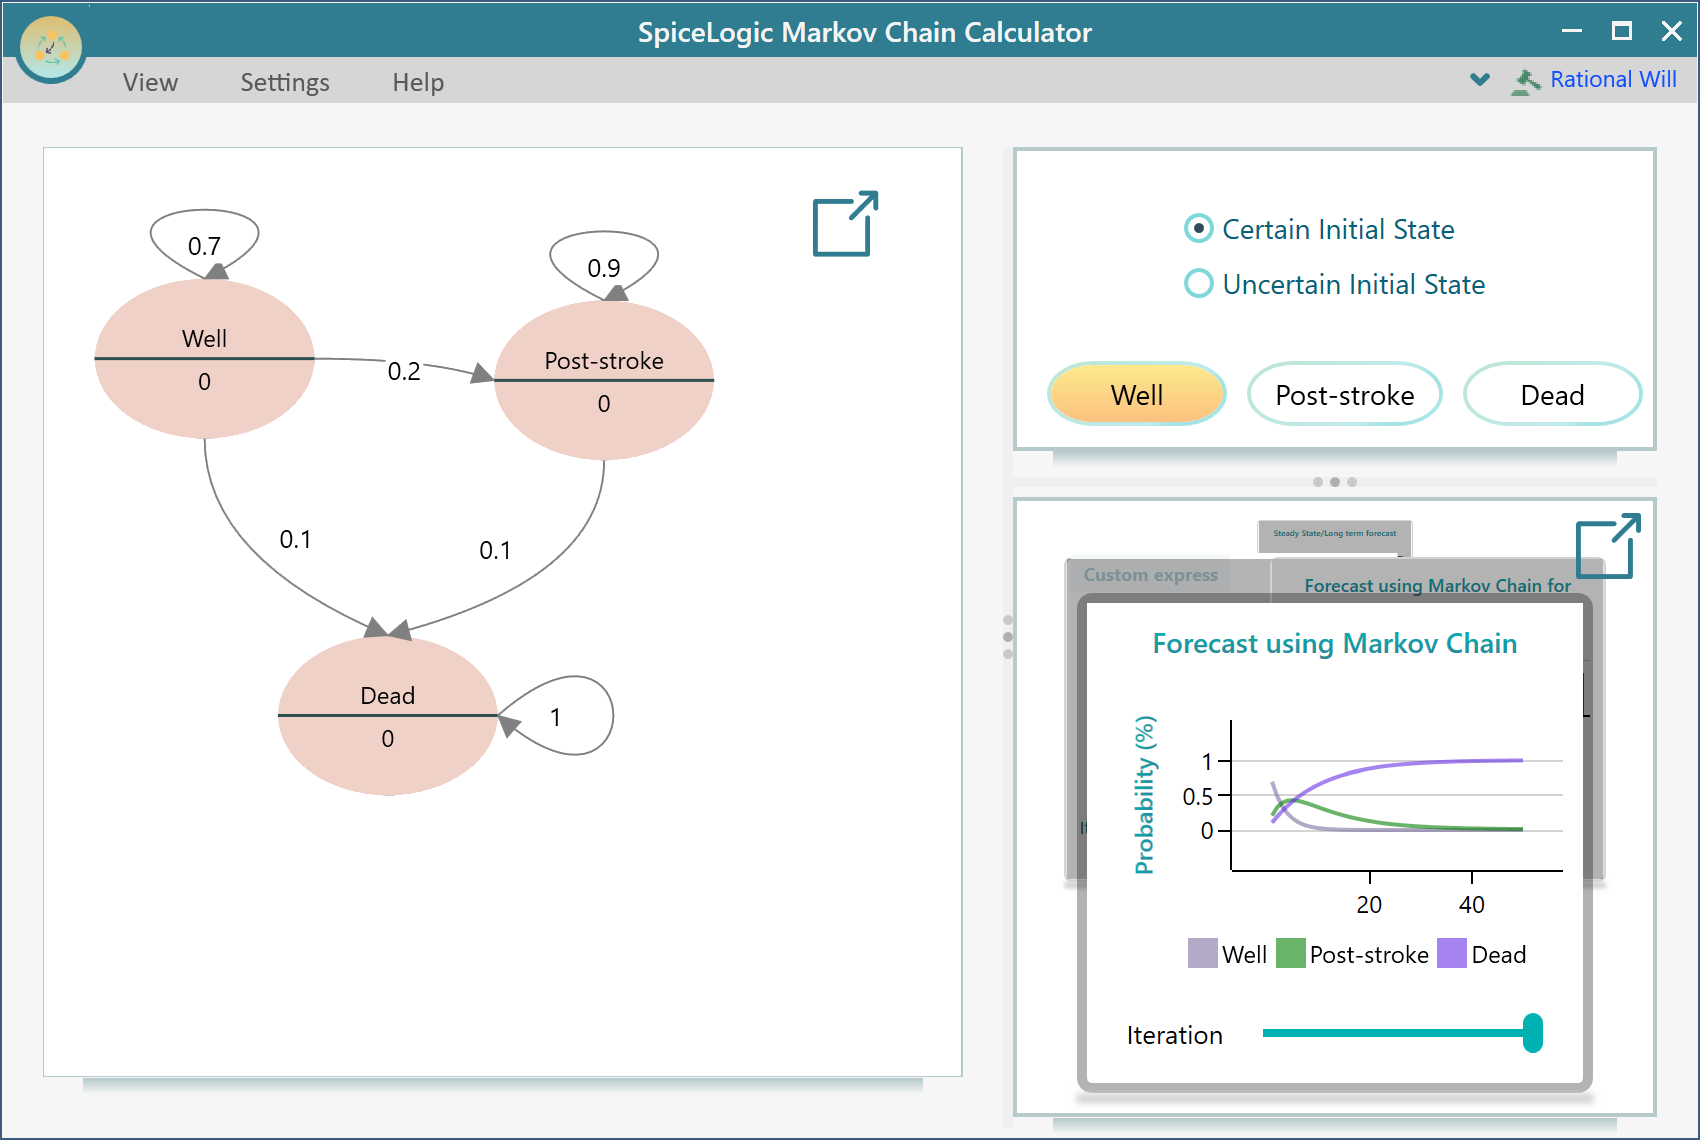
Analyzing Result
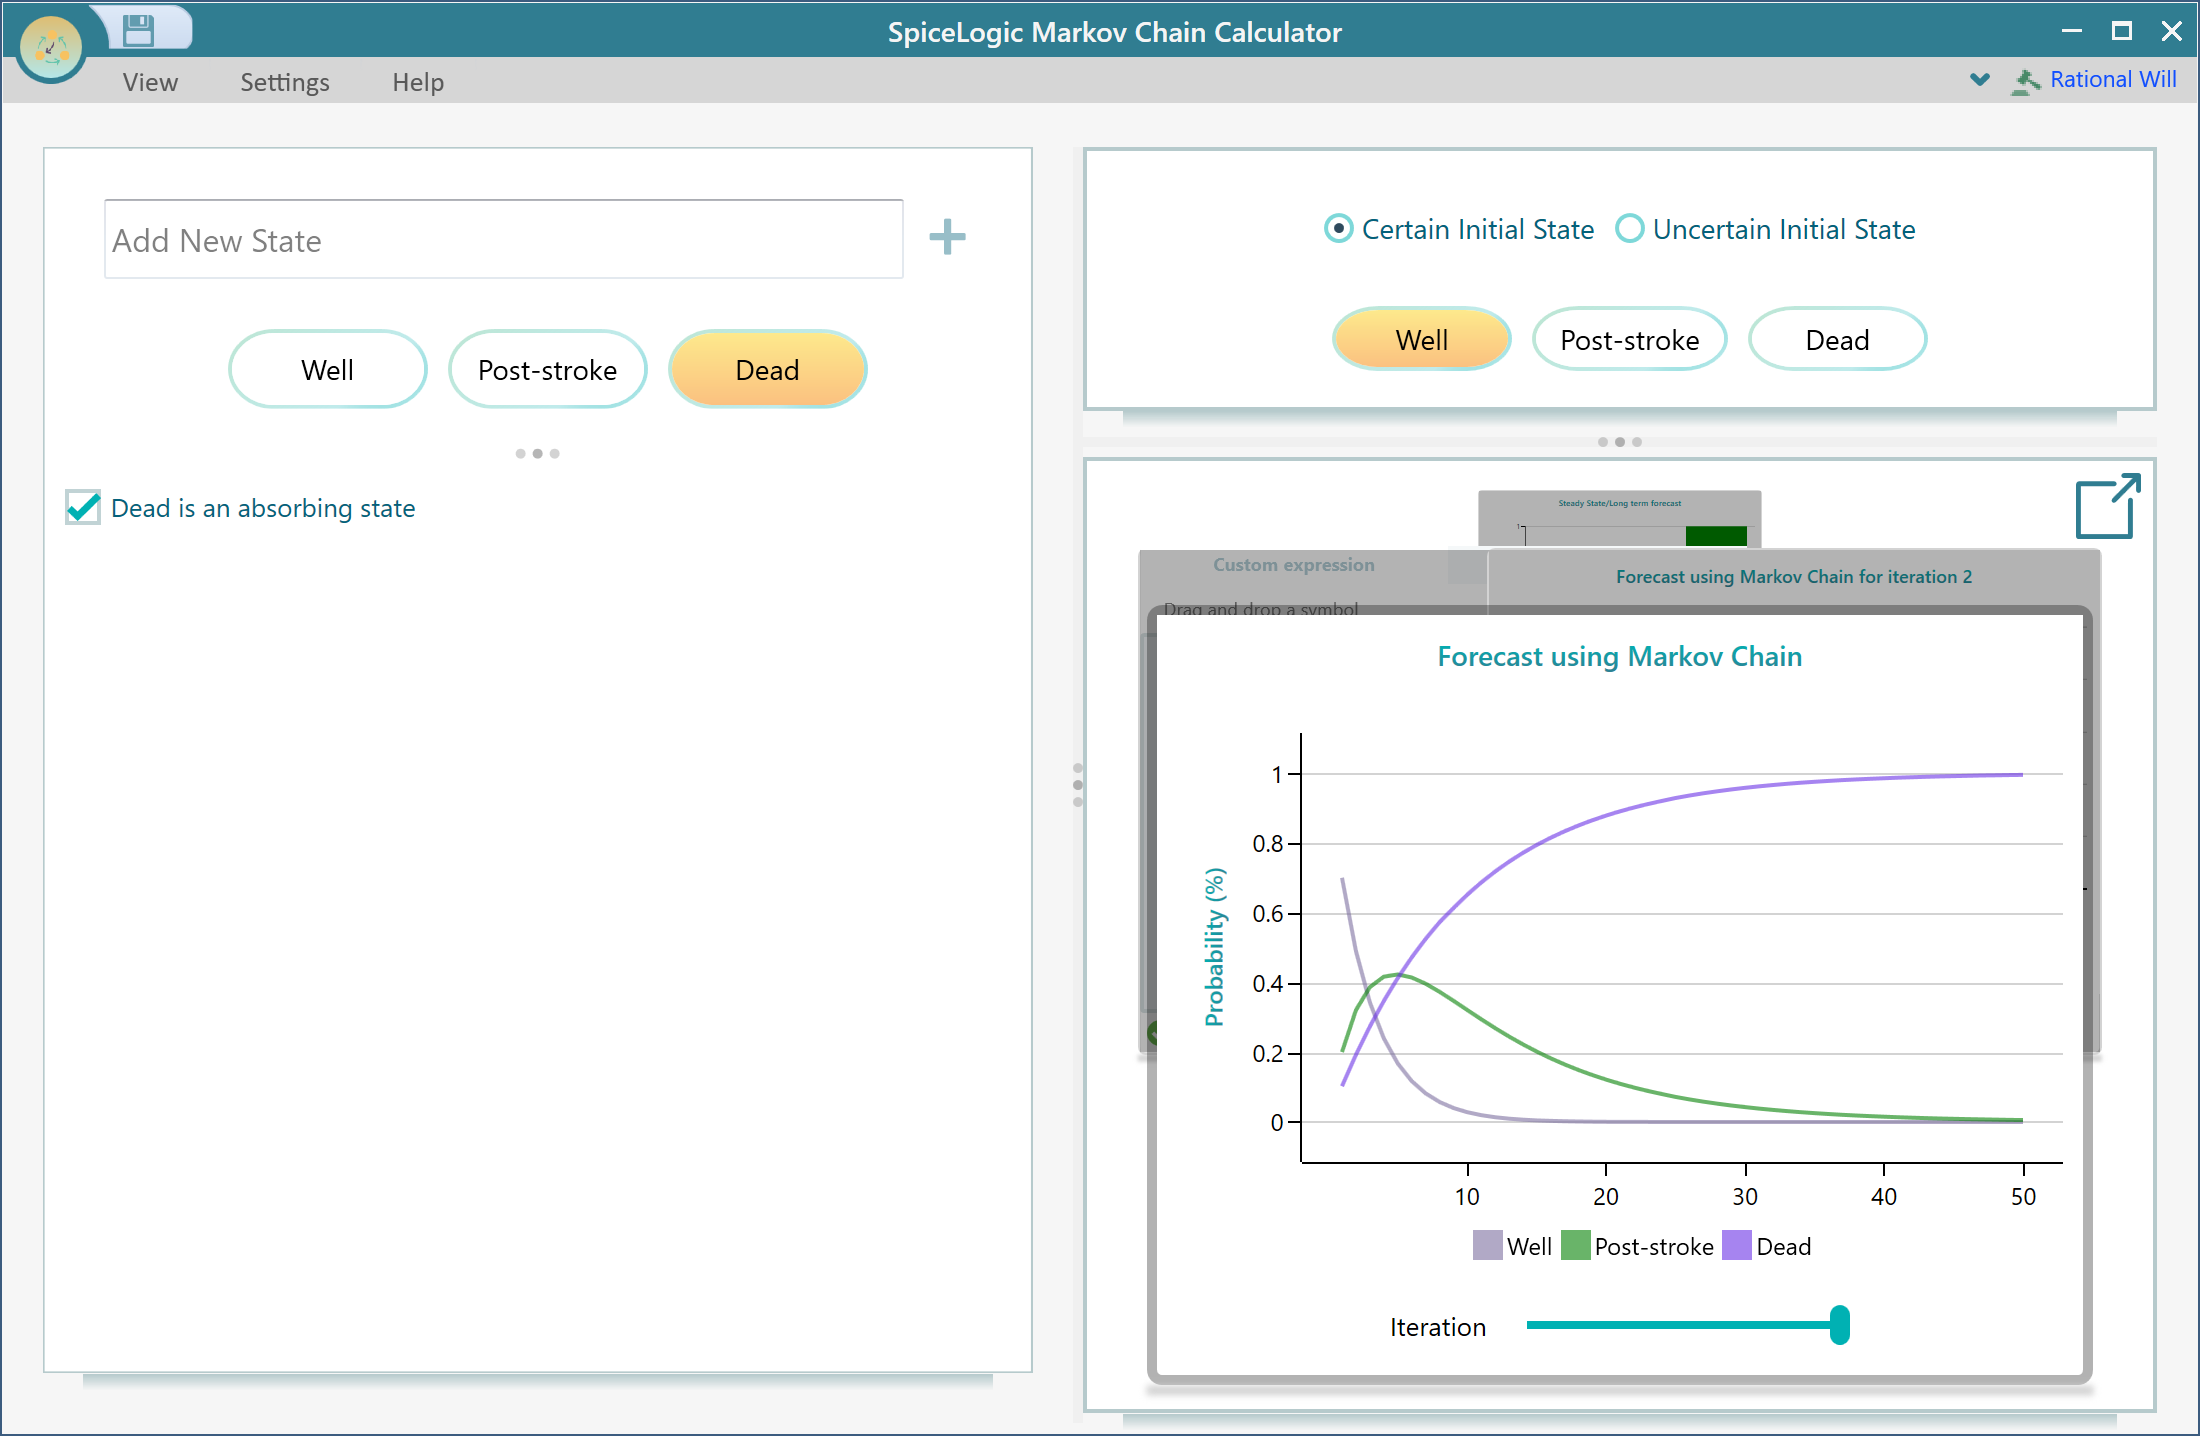
Make sure to select a state as your Initial State. By default, the first state will be selected as the initial state, which happens to be the state "Well" in this model, and that's what we want here. But in another model, you may need to select a different state as your initial state.
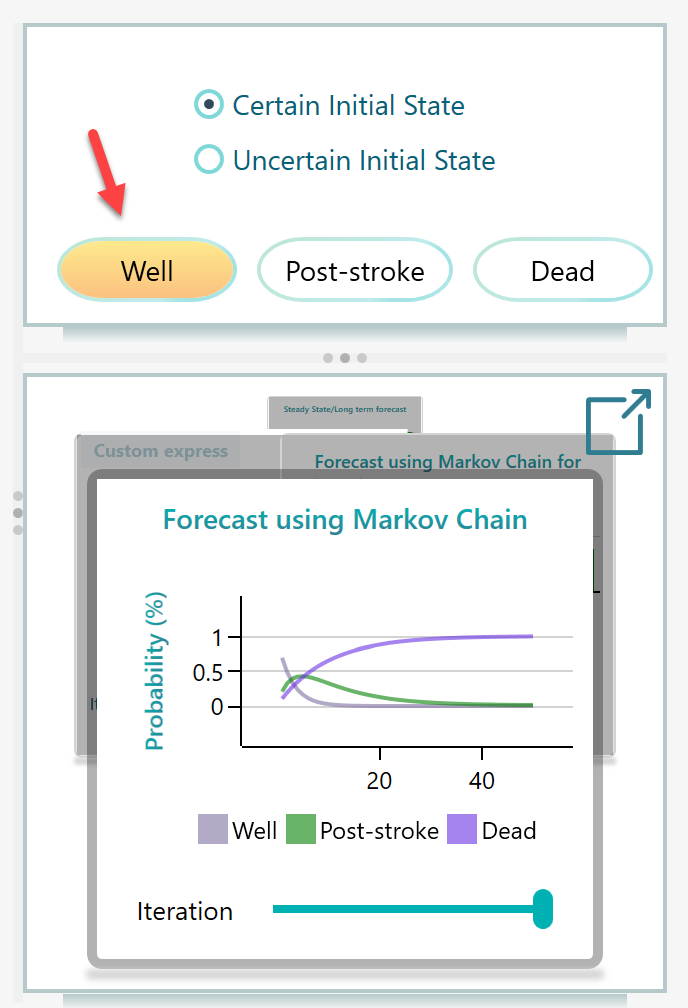
Notice that you can change the iteration number to a high value like 50 to get a smoother curve as shown above. You can get the following charts by clicking the Pop-out button as shown at the top right corner of the carousel.
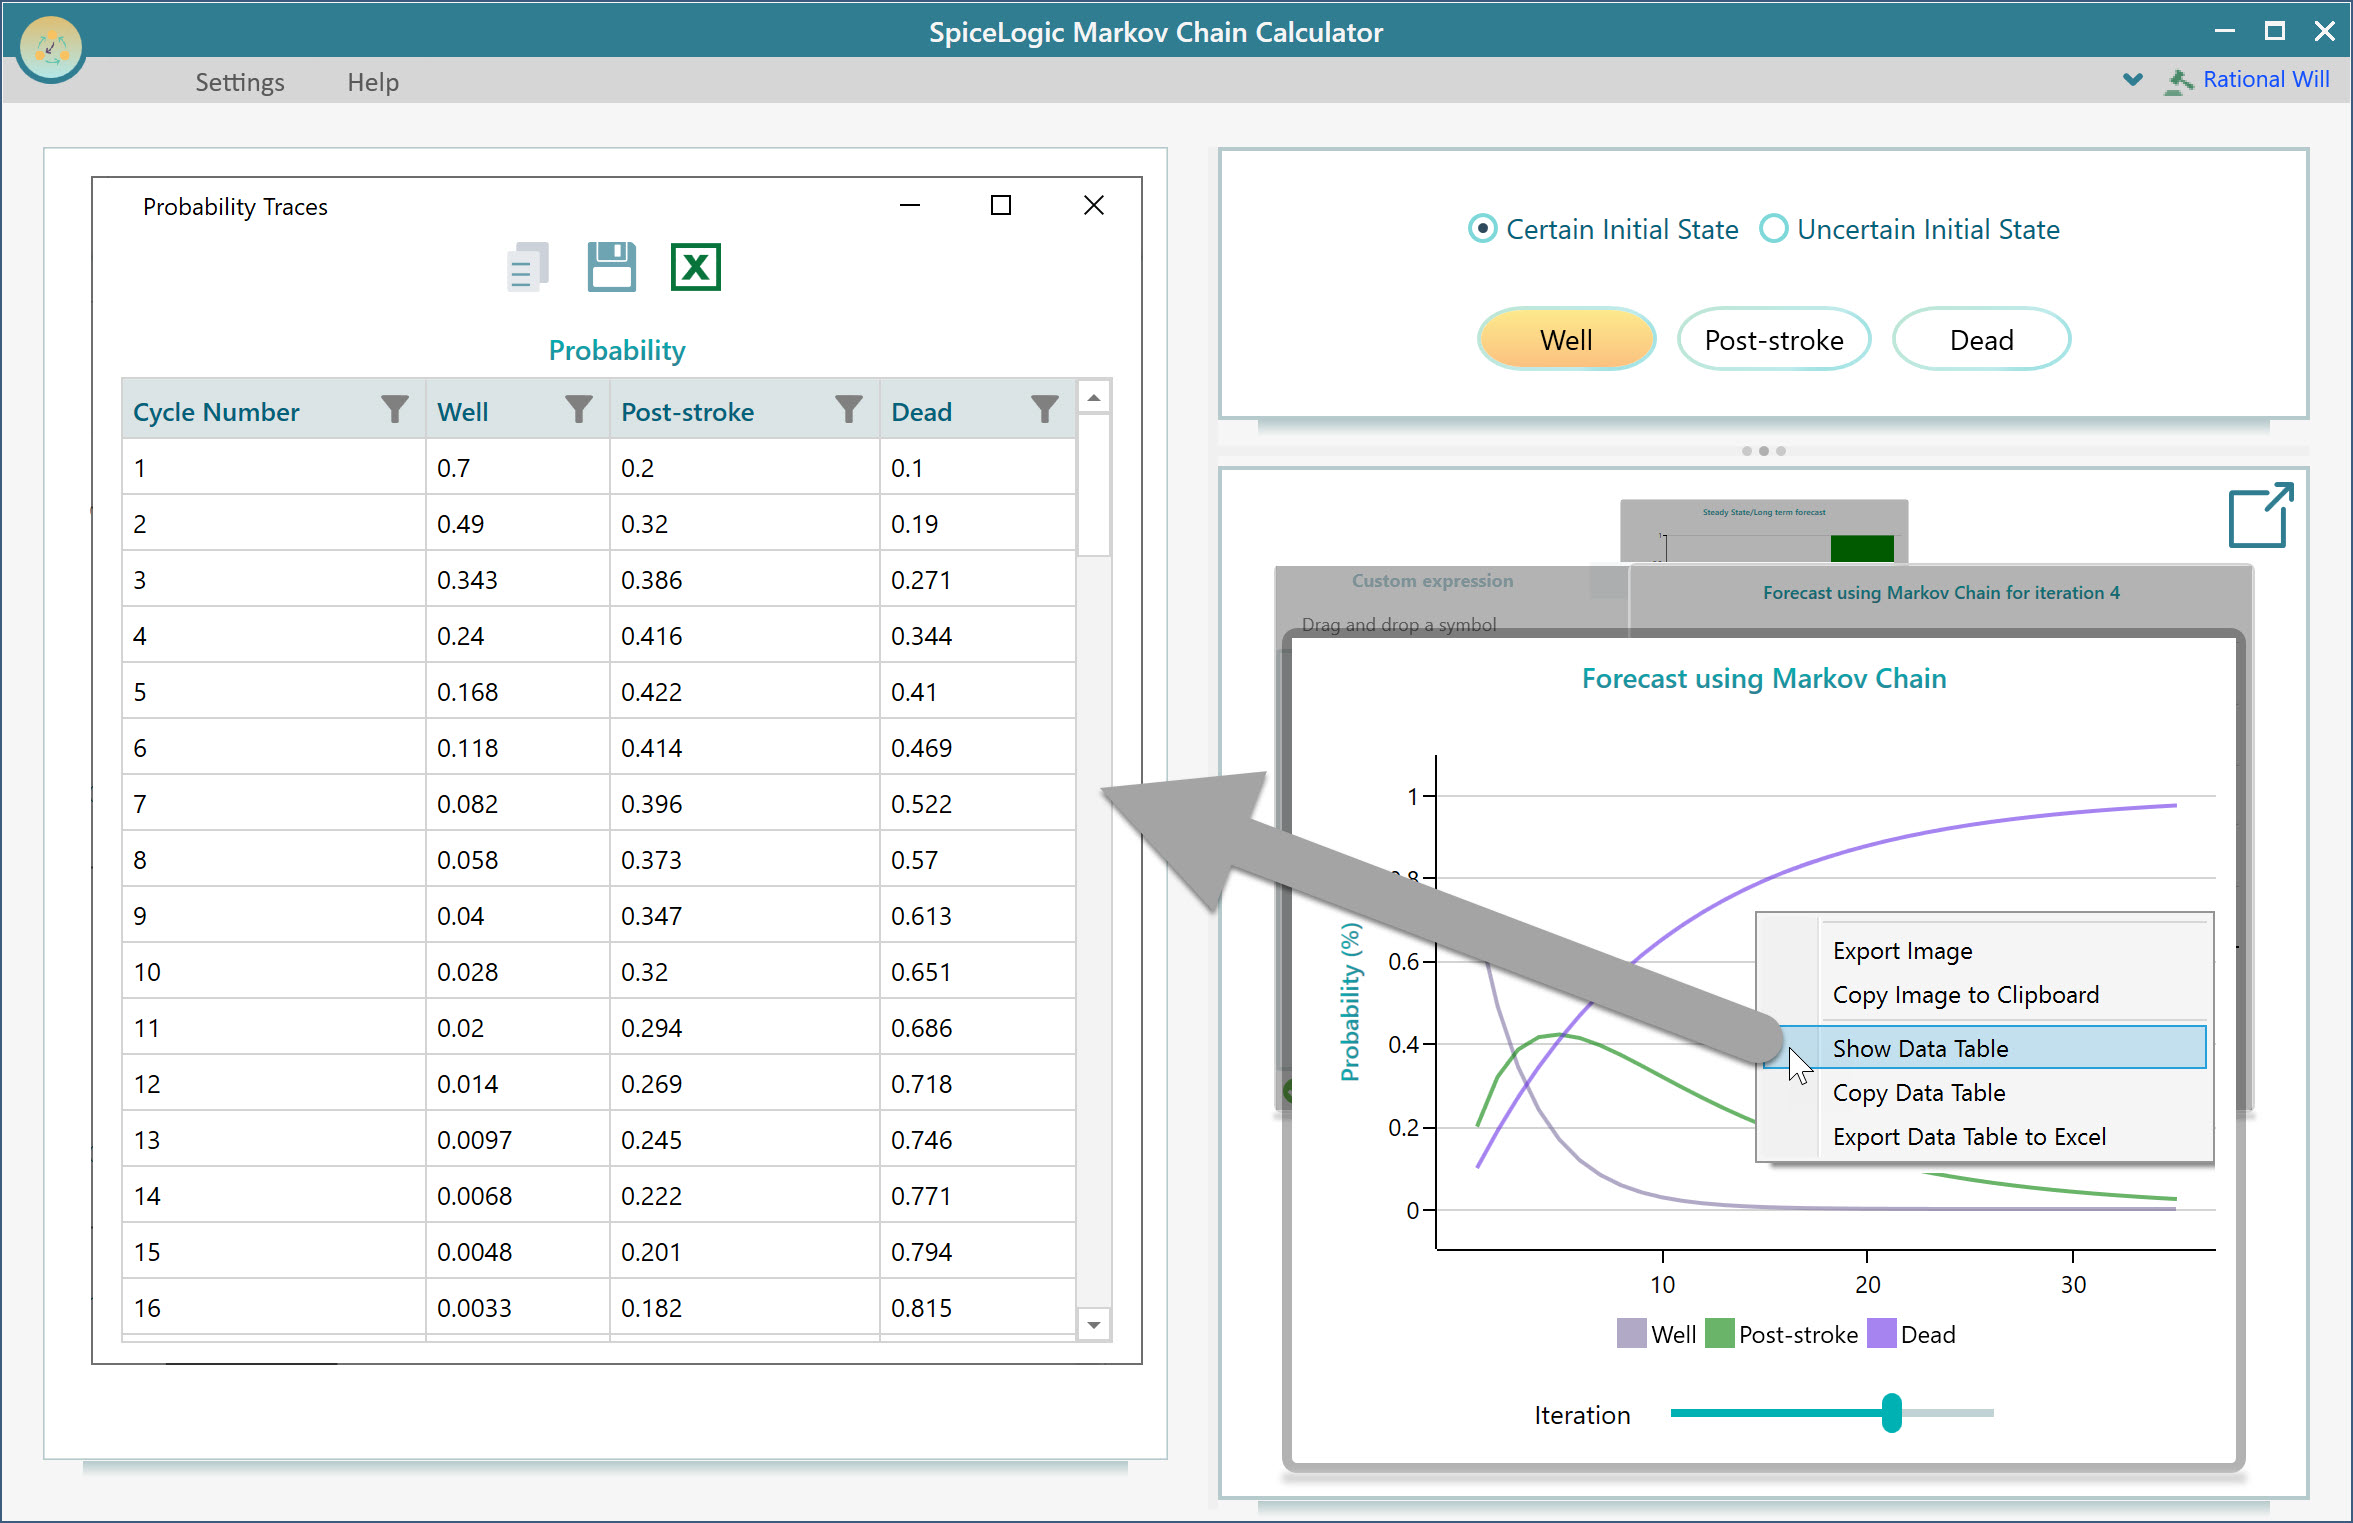
Viewing data table / Exporting to Excel
You may want to view the data table behind the charts and export it to Excel, right? Yes, you can do that. Simply right-mouse click on any chart and you will find the options to copy the chart image, copy table data, view data table, export data table to Excel, etc. For example, here is the view of the Probability forecast chart data table.
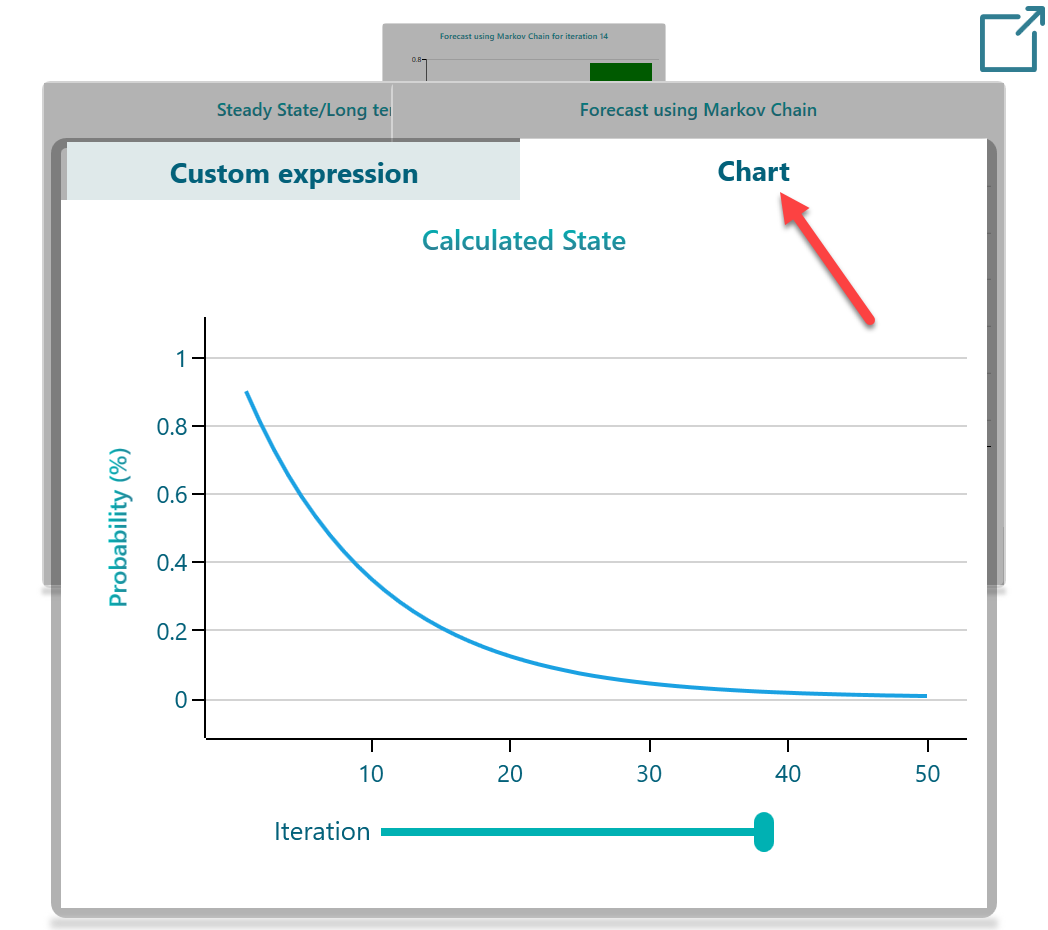
Calculating custom state using custom expression (i.e. Survival probability)
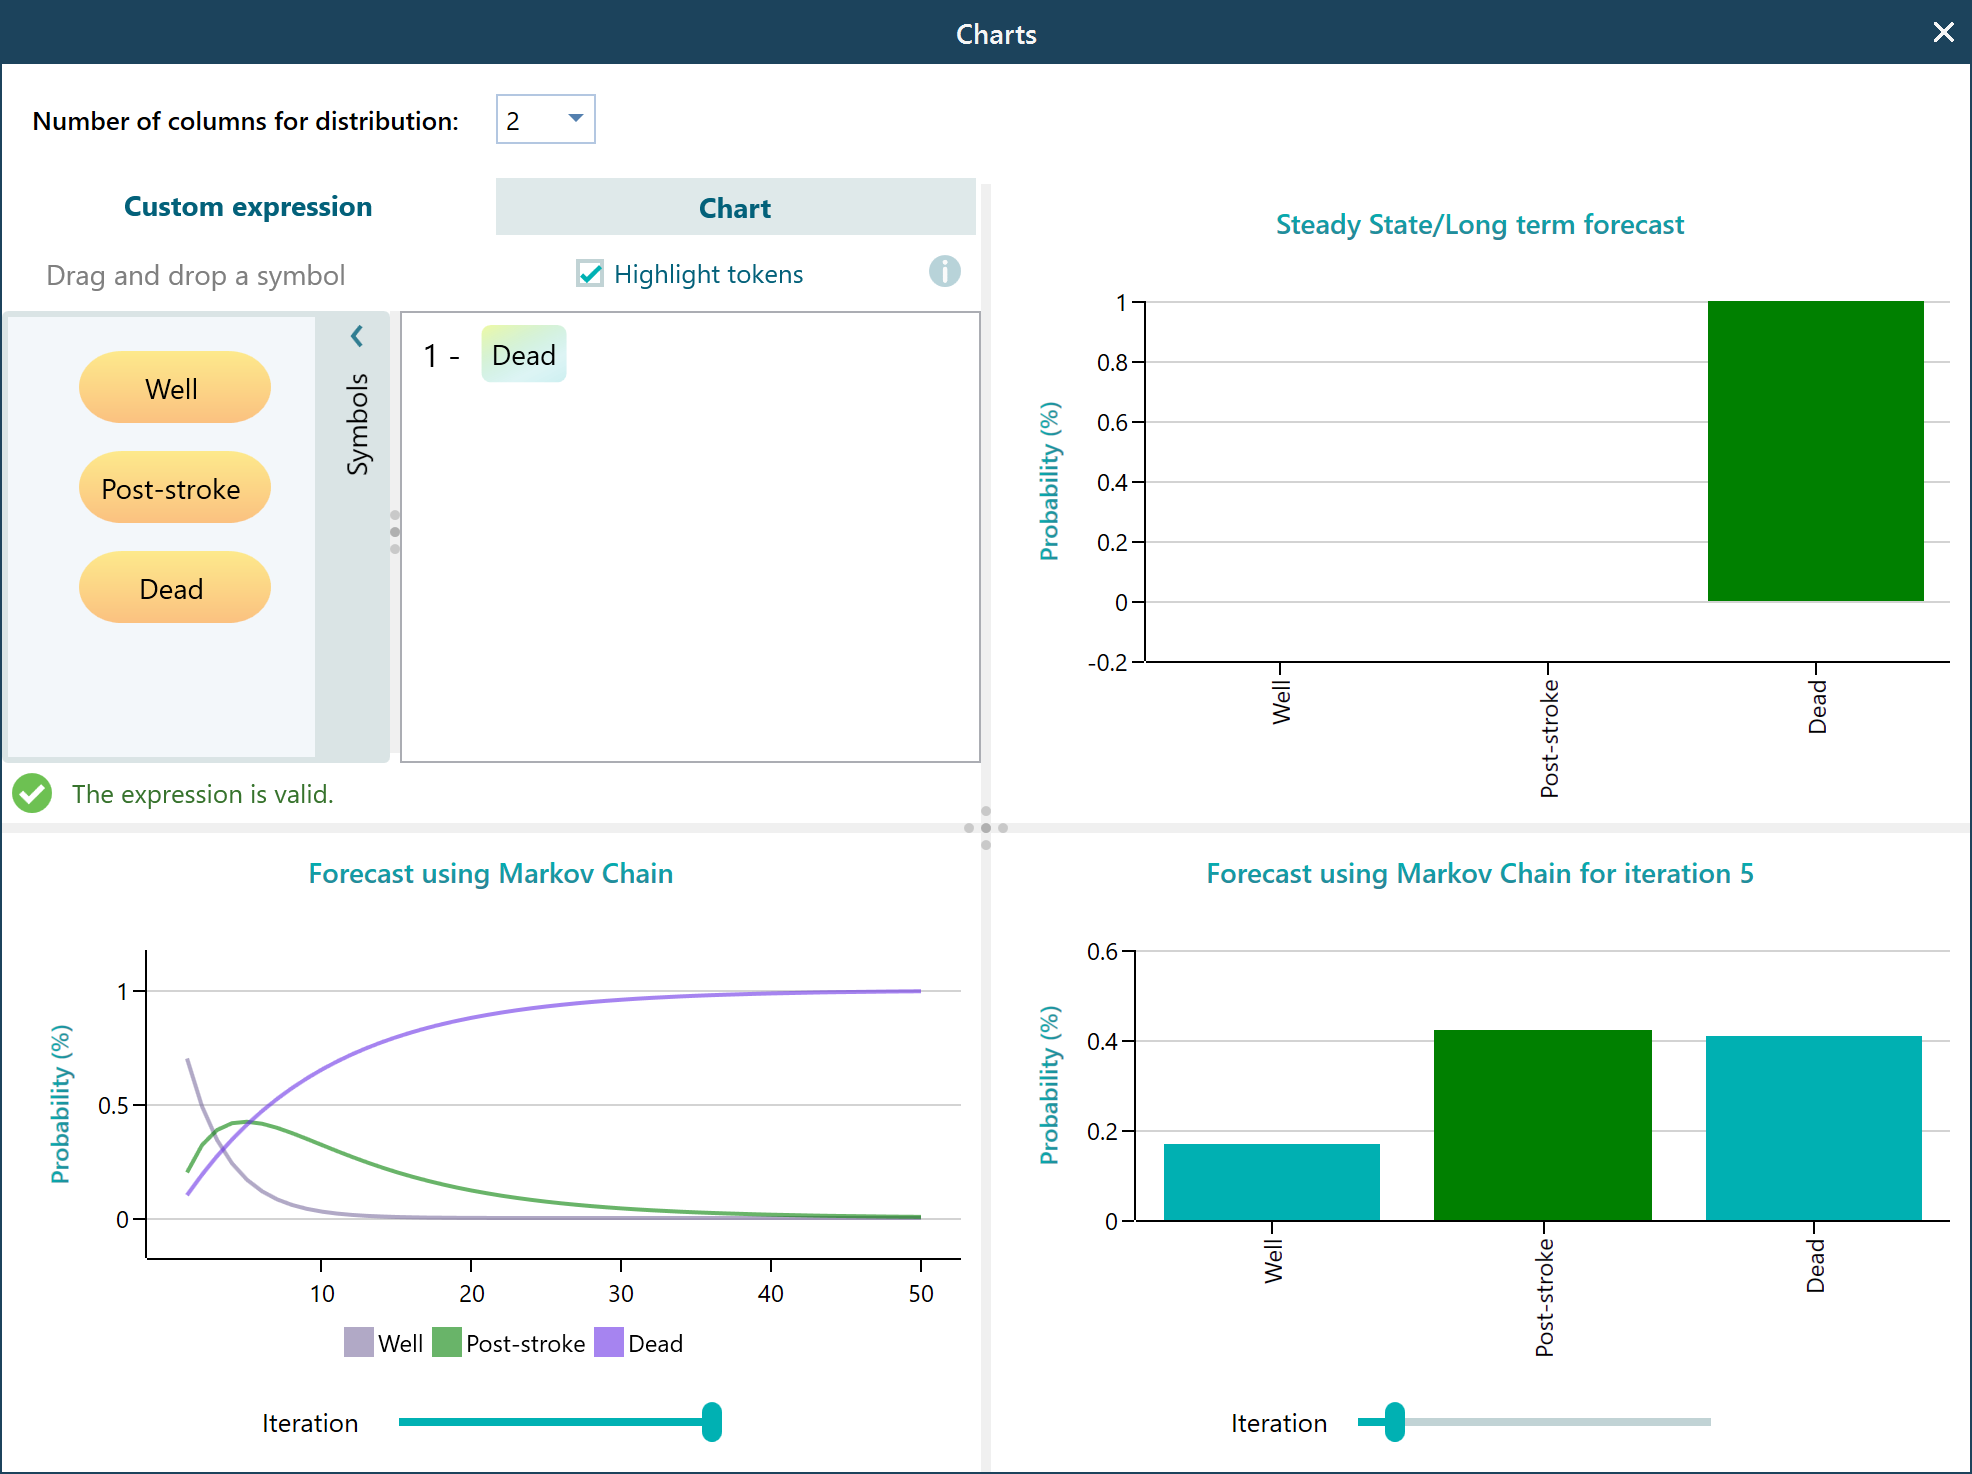
You may want to find the probability trace for a custom state like Survival Probability. Survival probability can be calculated as 1 - Probability of Dead. Right? There is a custom expression-based calculator in the chart carousel. Simply drag and drop a state name and enter your math expression. Here is the expression for Survival probability as shown below.
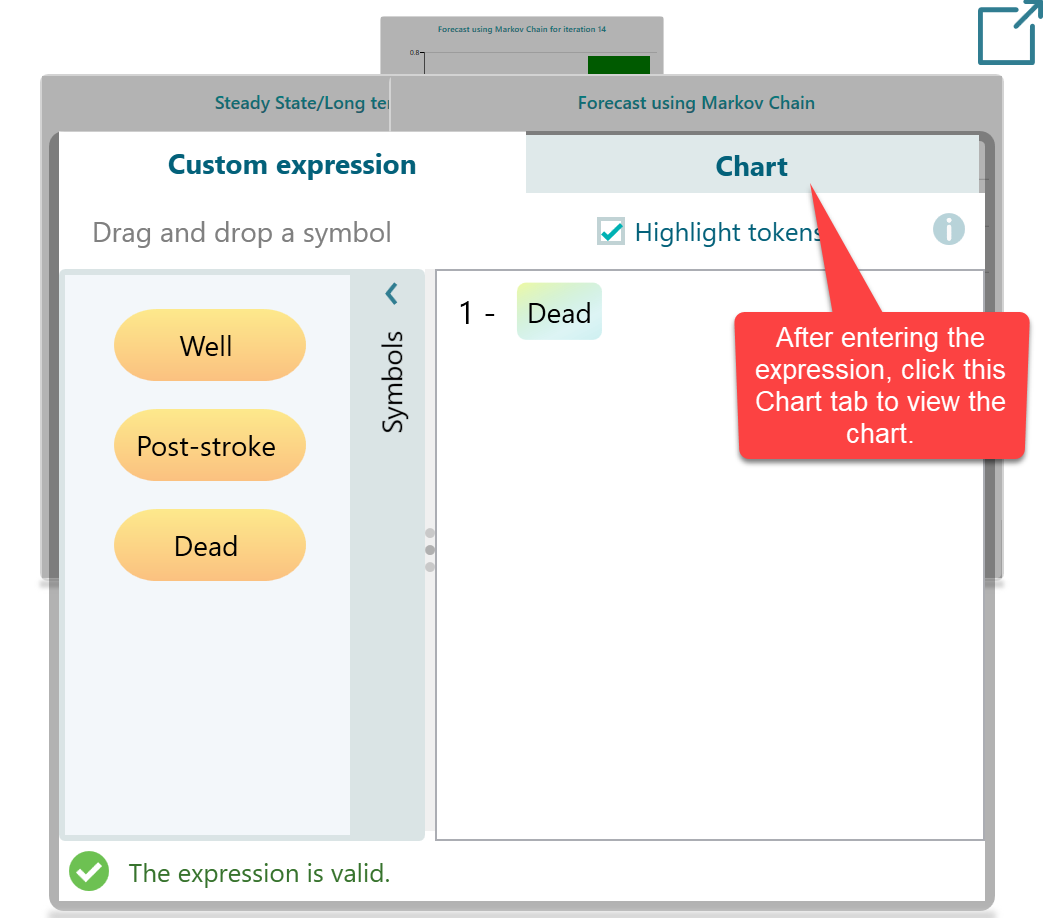
Once you view the Chart tab, you will see your chart for Survival probability.
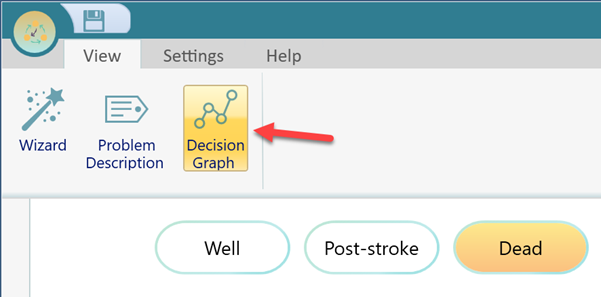
Viewing the graph
In the View menu, there is a button named "Decision Graph". Click that and you will see the cyclic graph view of this model.
And once that button is clicked, you will see a view like this, which you can drag and reposition to make it look better. As shown below.
Setting Reward to a state to calculate Expected Life years
In the Markov Chain Calculator application, a freeware from SpiceLogic, you are limited to performing only probability analysis. But if you want more like setting a reward or utility value to a state and performing expected utility analysis, calculating life expectancy, etc, then please check our flagship decision analysis software "Rational Will". For example, here is the documentation that shows how to set a time-variant probability and state reward to calculate life expectancy.