Calculating Life Expectancy with time variant probabilities
In this example, we will show how to utilize the Markov Chain to calculate the life expectancy of a cohort.
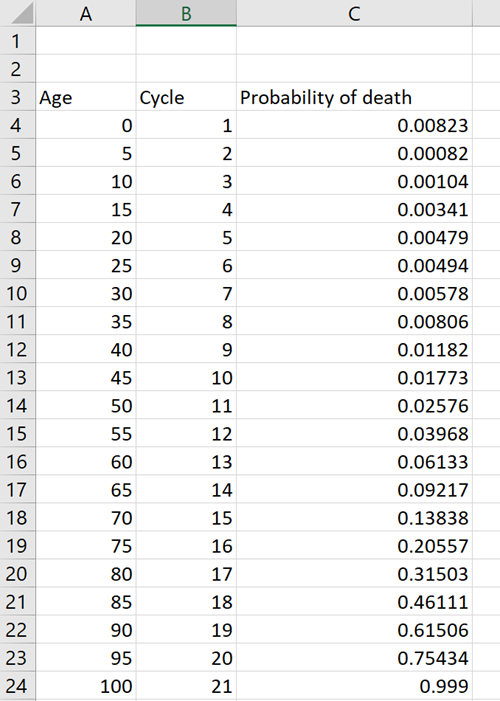
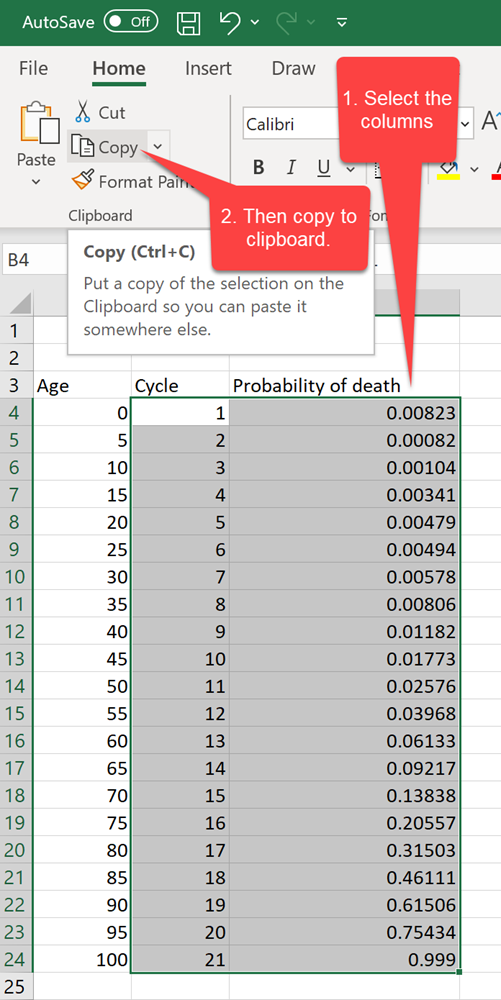
Say, a cohort of 10,000 people has a probability of death from year 0 years to 100 years as shown in the following table.
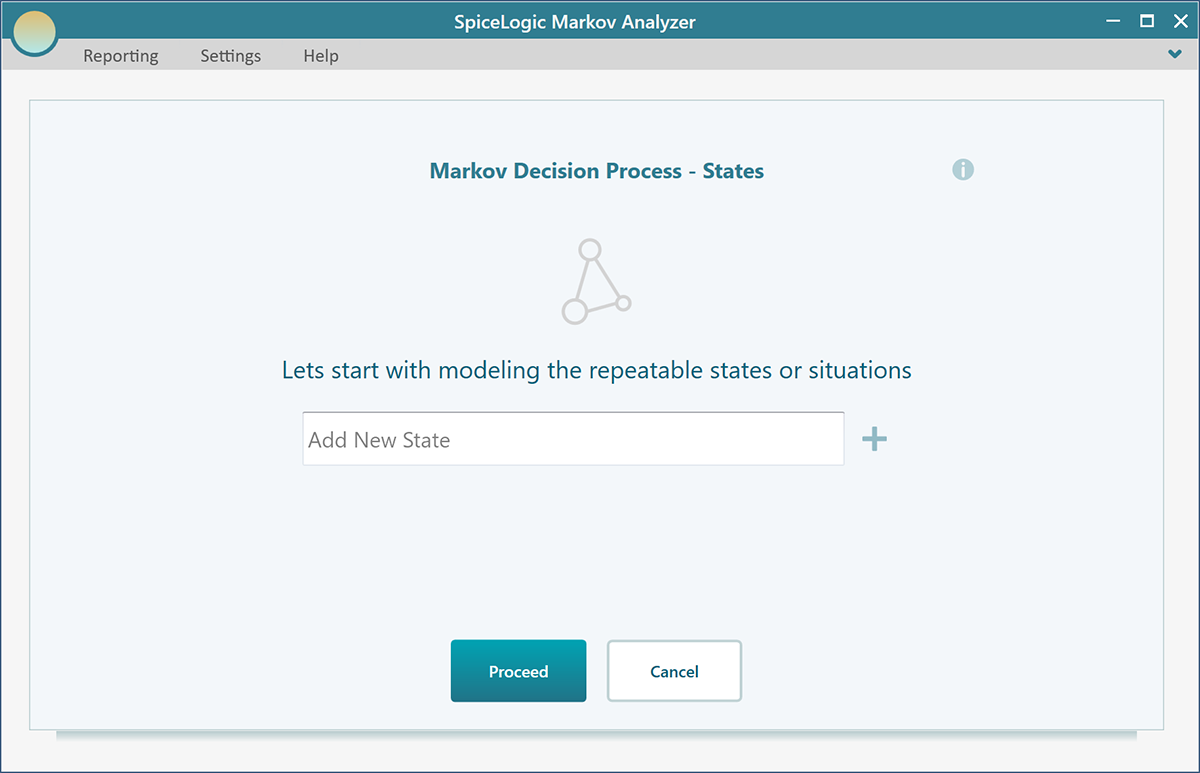
Let's start with the Markov Decision Process software. You will see a wizard shows up like this:
Step 1: Creating the Markov States
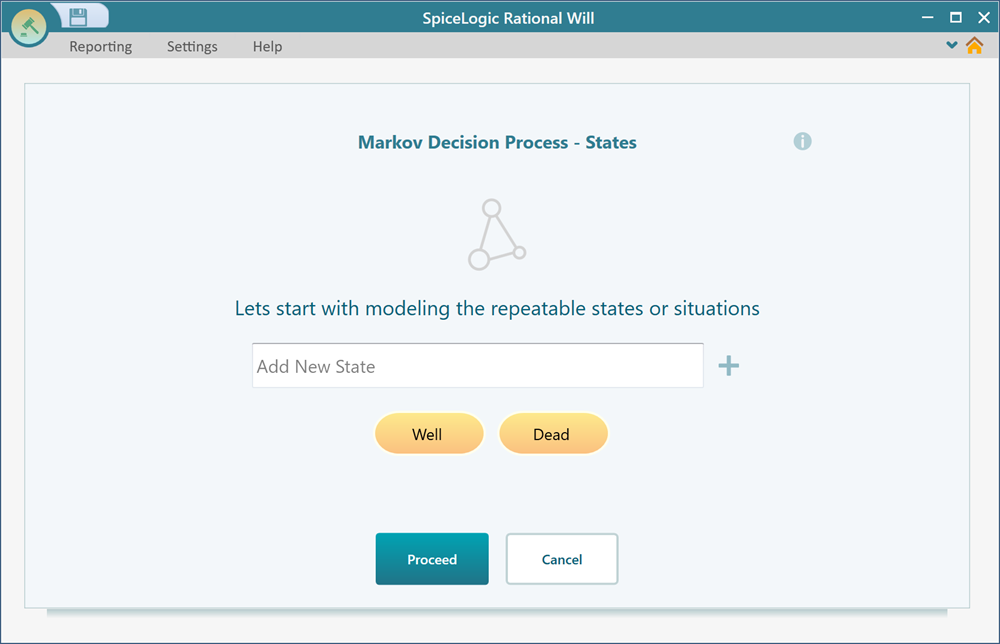
In this wizard, add two states named "Well" and "Dead". Click Proceed.
Then, you will be presented with the following question.
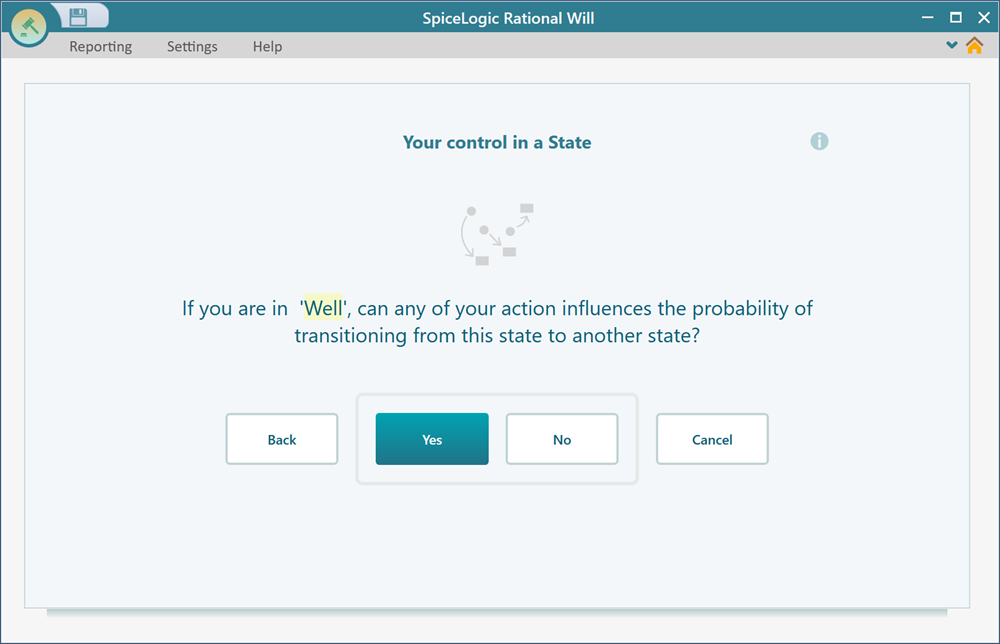
In simple words, it is asking, do you want to use Action in your Markov Model? For this project, we do not have Markov Action, rather we have only Markov states. So, click No. Then you will be asked the same question for the state "Dead". Answer No as well.
Step 2: Setting up Markov Simulation Process
Once you clicked 'No' in the previous step, you will be asked to set up your Markov simulation setting. Markov Model is solved by Cohort Simulation, and you can configure the simulation parameter. When you are done specifying your Markov States and Actions, you will be presented with the following screen to configure your Markov simulation. For our simulation, let's use Half Cycle Correction, so check the box for "Half Cycle Correction". For our example, we need to set the number of iterations to 21, and the duration for each cycle = 5 years. You can set the Cohort Size to 10,000 even though the result won't vary much based on the various cohort size. The higher the number is, the more accurate the result will be. For this case, 10,000 is good enough.
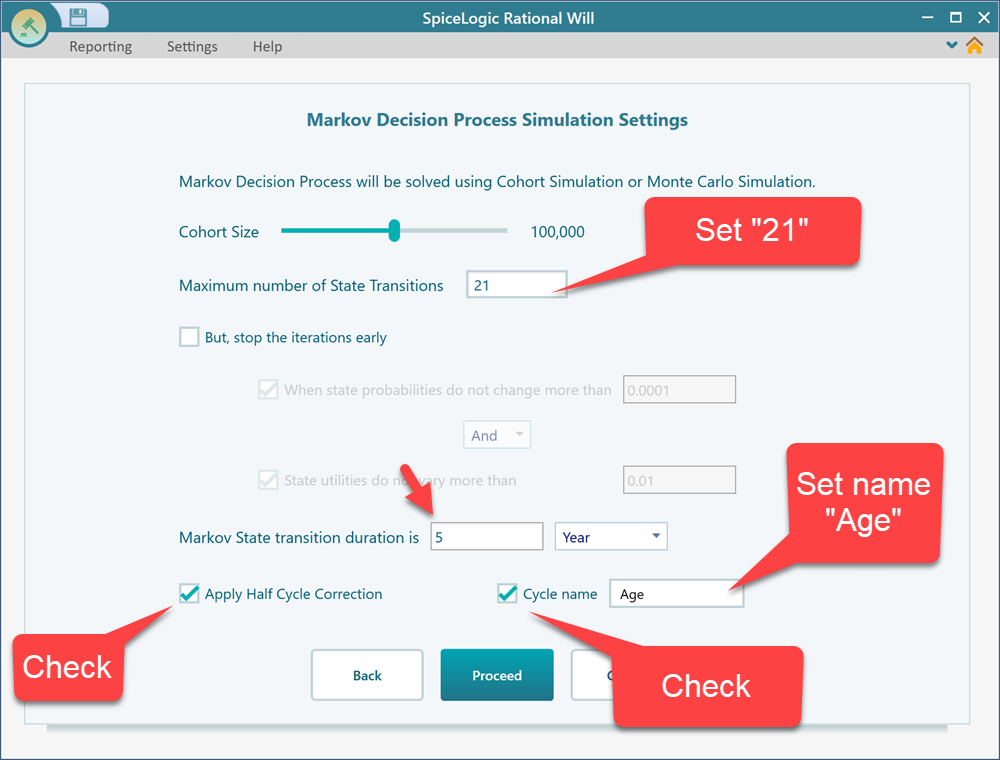
Now, click "Proceed".
Step 3: Setting transition probabilities (importing from Excel)
After clicking proceed from the previous step, you will be asked to set up your transition probabilities.
![]()
For our case, we have a variable transition probability that depends on age. So, check the box "At every cycle, the probability depends on the cycle number (time-variant)" as shown in the above screenshot. Once you check that box, you will be presented with the following screen. This is a carousel of all state transitions.
![]()
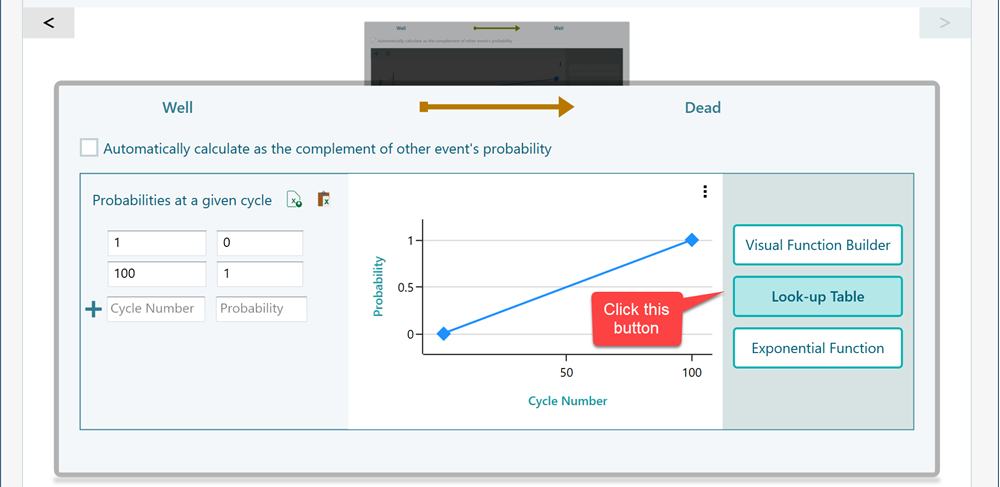
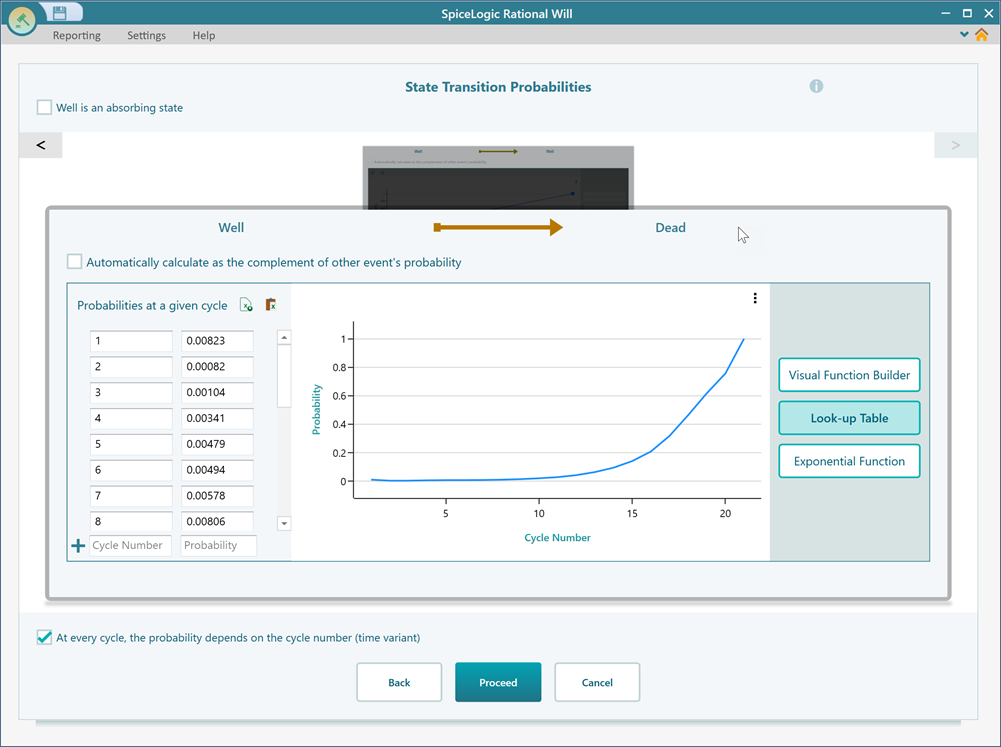
From the carousel, select the transition for Well-Dead. If you see the "Automatically calculate as the complement of other event's probability" box checked for the "Well - Dead" transition, uncheck that box.
![]()
Then, click the "Look up table" button. Then click the button for "Lookup table". You will see a view like this. In this view, notice that there is
Then, open your Excel file and select the columns where the first column contains the Cycle number and the second column contains the probability. After selection, Copy the data to your clipboard.
Now, get back to the Decision Tree software and click this button to import the table from your clipboard. Please make sure that your data format is correct as shown in the above screenshot.
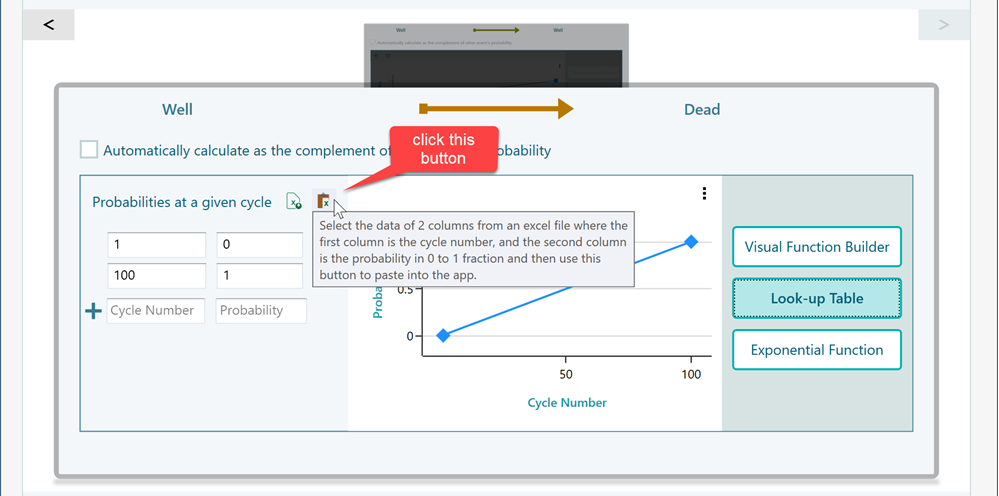
Once you click that import button, you will see the data is imported as shown below.
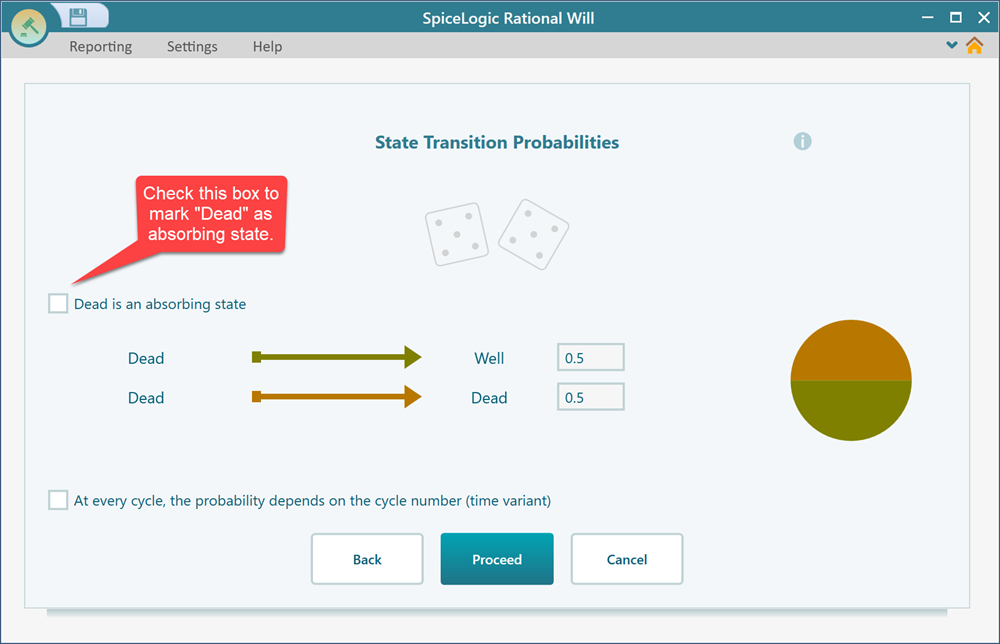
Now, Click "Proceed". You will be asked to set the transition probabilities for the "Dead" state. As you know, "Dead" is an absorbing state, which means, the probability of transitioning to any other state from the "Dead" state is 0. So, check this box that says "Dead is an absorbing state".
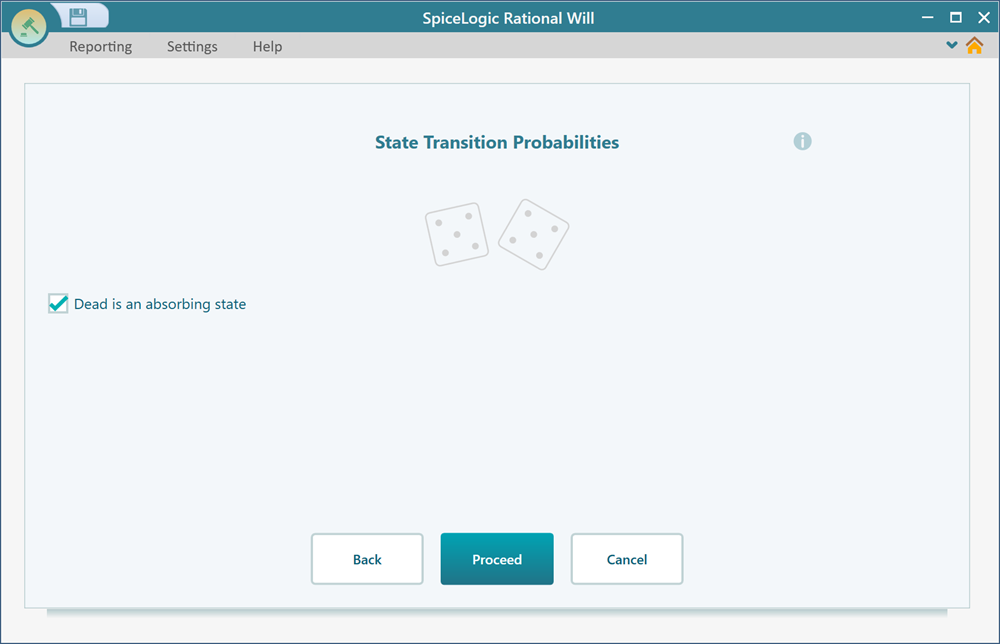
After checking that box, the transition probability controls will be hidden. Now, click Proceed.
Step 4: Setting Initial State
Once you click "Proceed" from the previous state, you will be asked to set your initial state. You can either set a certain initial state or a probability of the initial state.
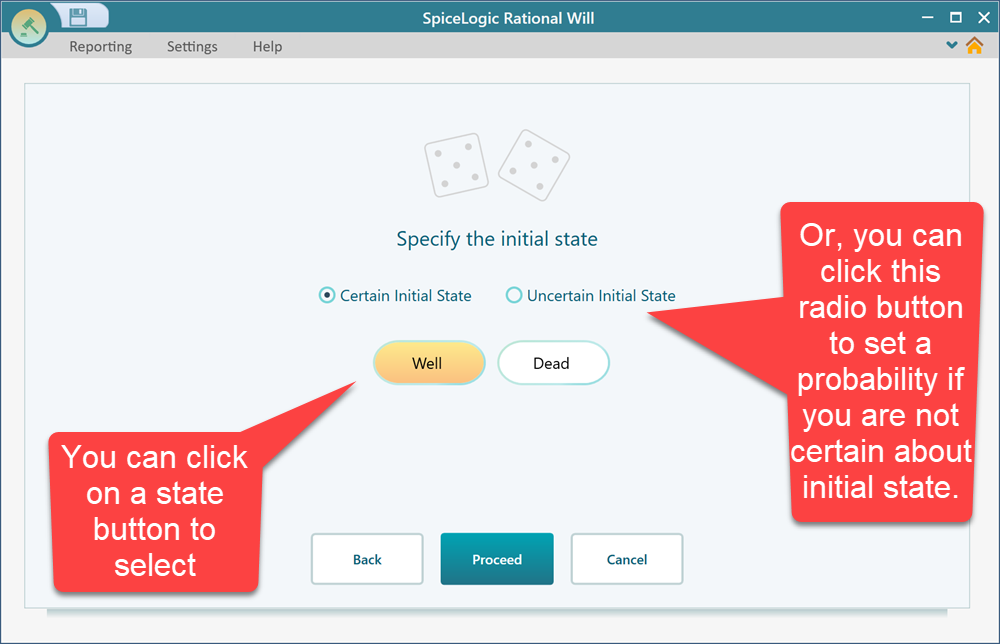
In the following screenshot, you can see what it will look like if you choose Uncertain Initial state.
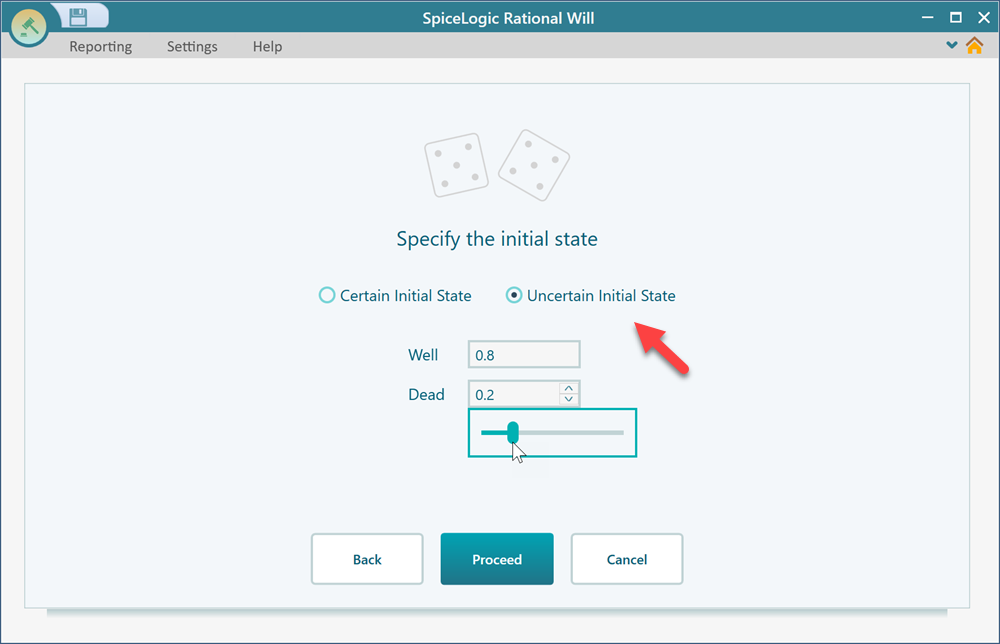
But for our model, keep it back to a Certain Initial State for the "Well" state.
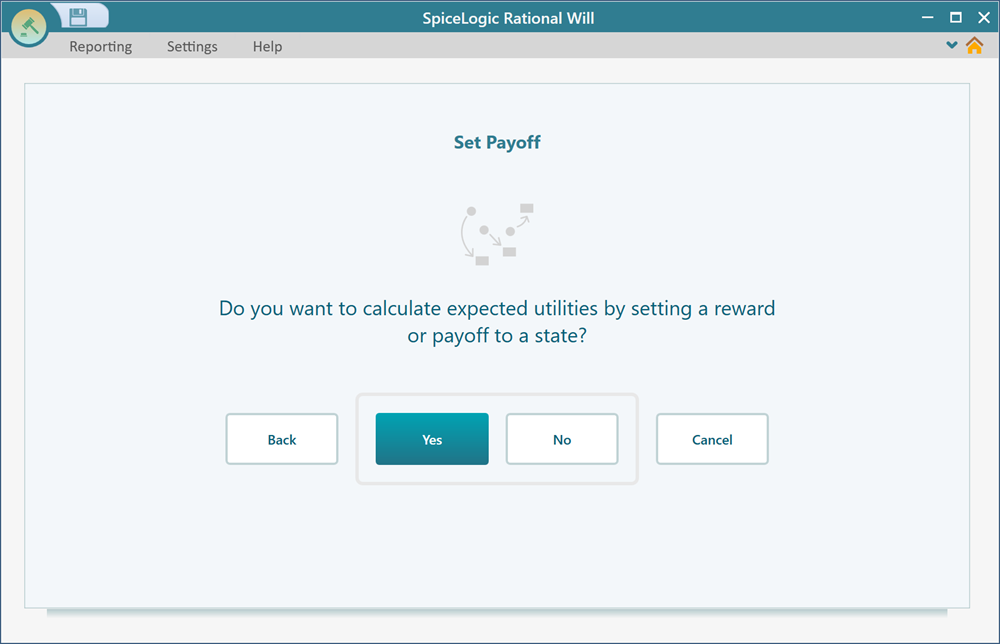
Step 5: Setting Payoff or Reward
Once you click the Proceed button, you will be asked if you want to set Payoff for your state. In our case, yes, we want to set a payoff. The payoff is the life year. In every iteration, we land to the state "Well", we gain 5 life years. So, click "Yes" on the following screen.
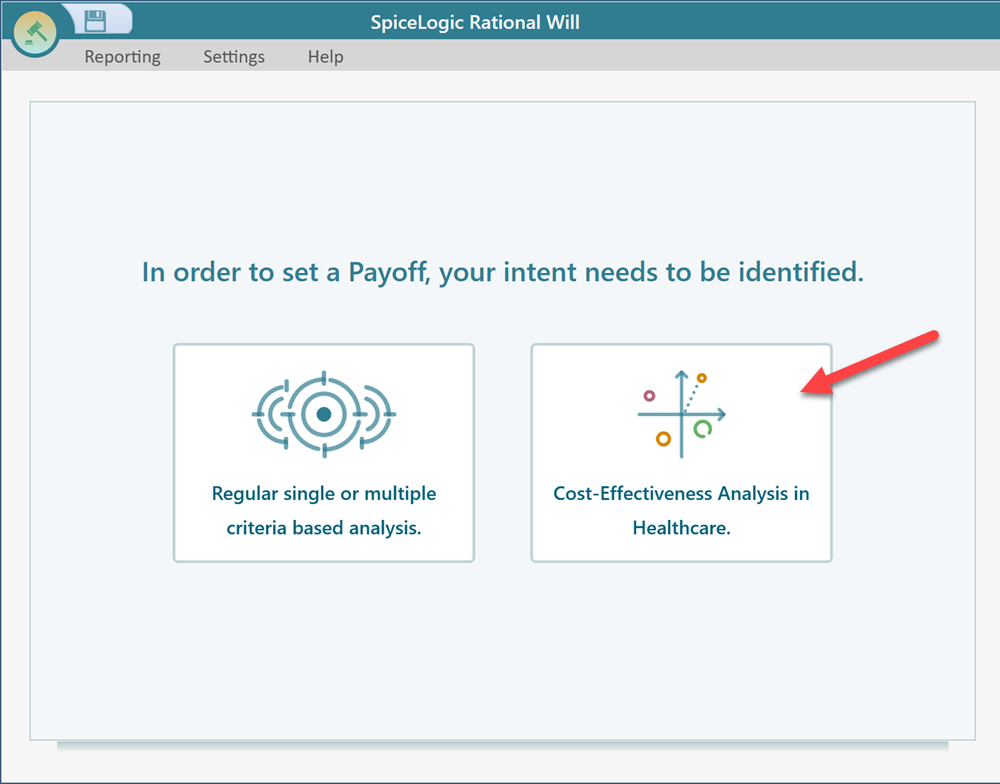
Then, choose the "Cost-Effectiveness Analysis in Healthcare" button.
Then, the cost-effectiveness setup window will appear.
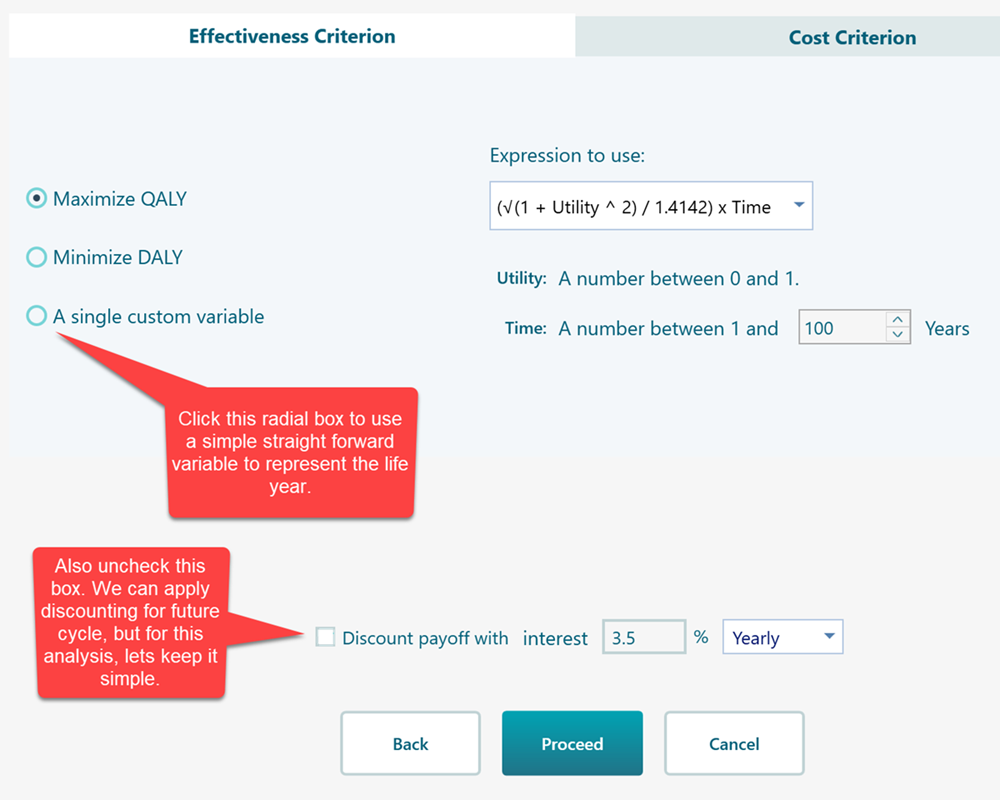
Once you check that radial box for a custom variable, you can define your variable as shown below.
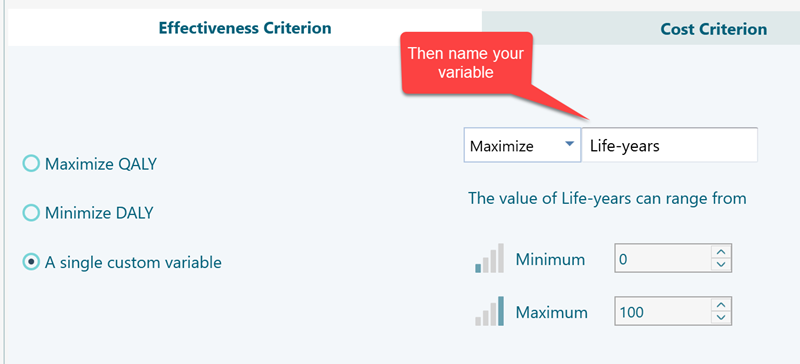
For this analysis, we do not need to configure Cost. So, just click Proceed after that. Then, you will be asked to set the reward in the "Well" State. Set the Life year "5" for the state "Well".
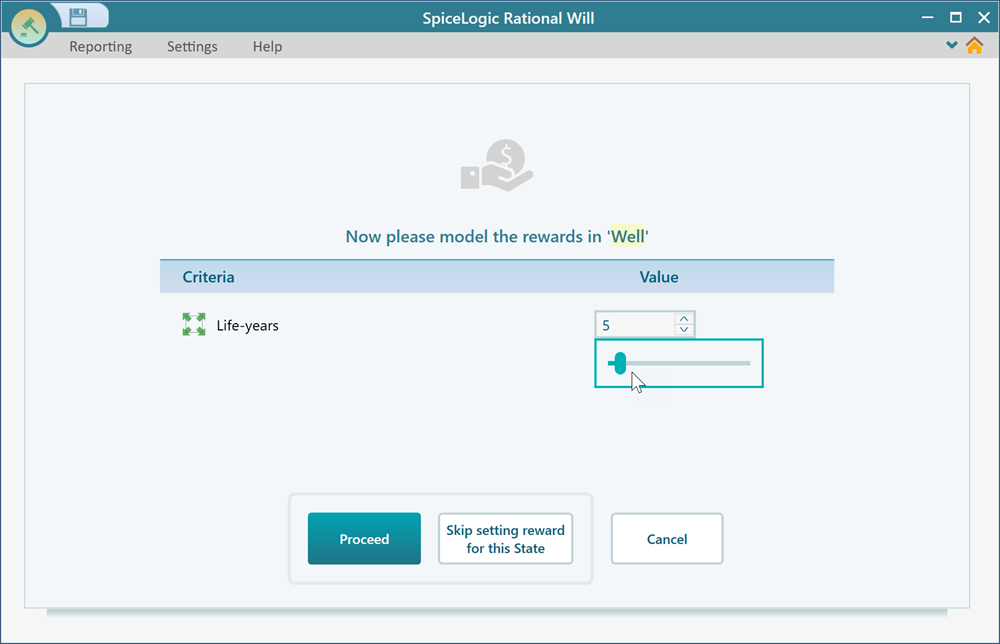
Then, click "Proceed". You will be asked to set a reward for the "Dead" state. You can either set the value to 0 or click the button "Skip getting a reward for this state". Once you do that, you will see your final Markov Model ready as a Decision Tree Diagram.
Step 6: Analyzing Result
In the diagram, notice that the expected value is displayed over the node. We can see the expected life year is shown as 76.87. So, 76.87 is the life expectancy of this cohort.
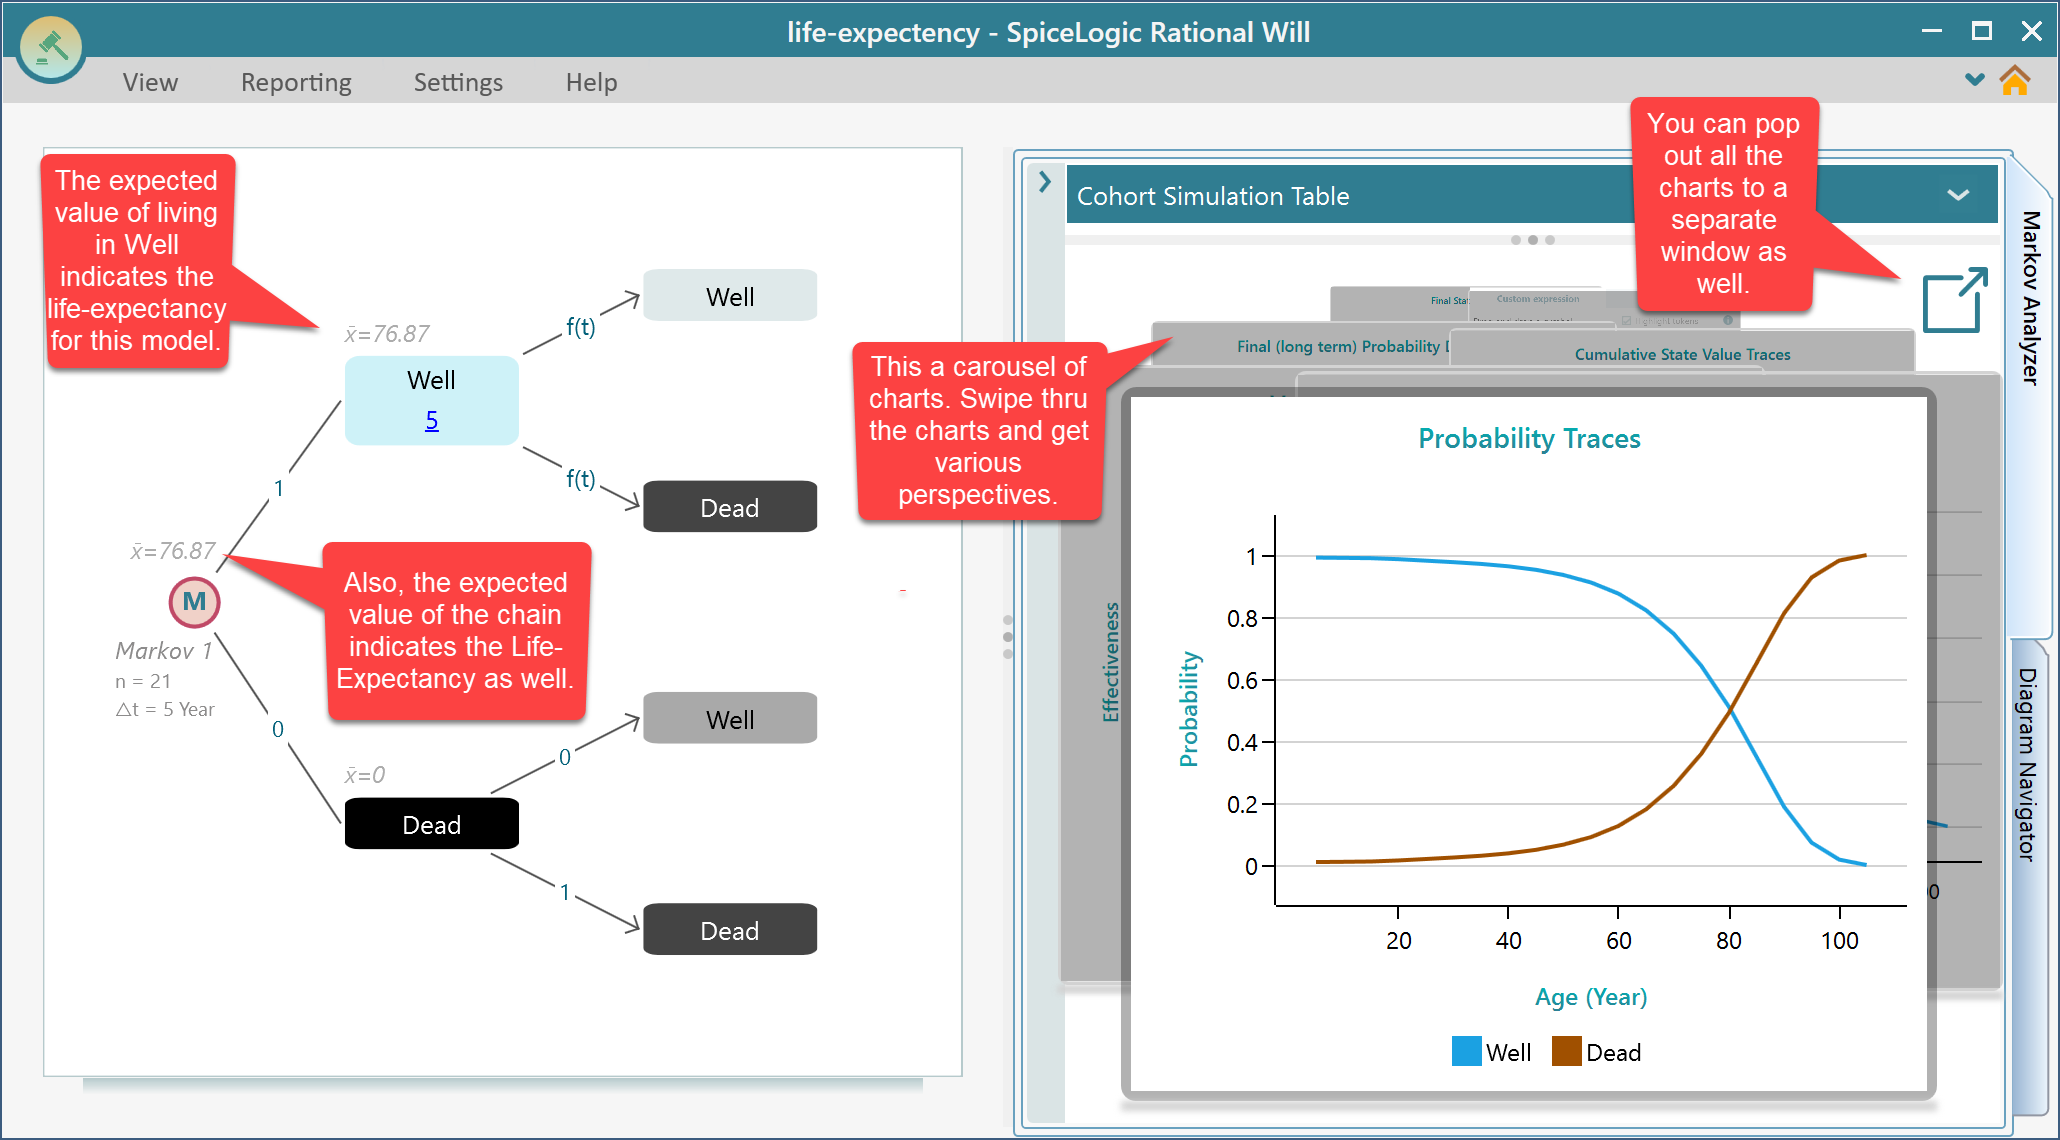
Once you click on the pop-out button, you will see the charts shown as a grid.
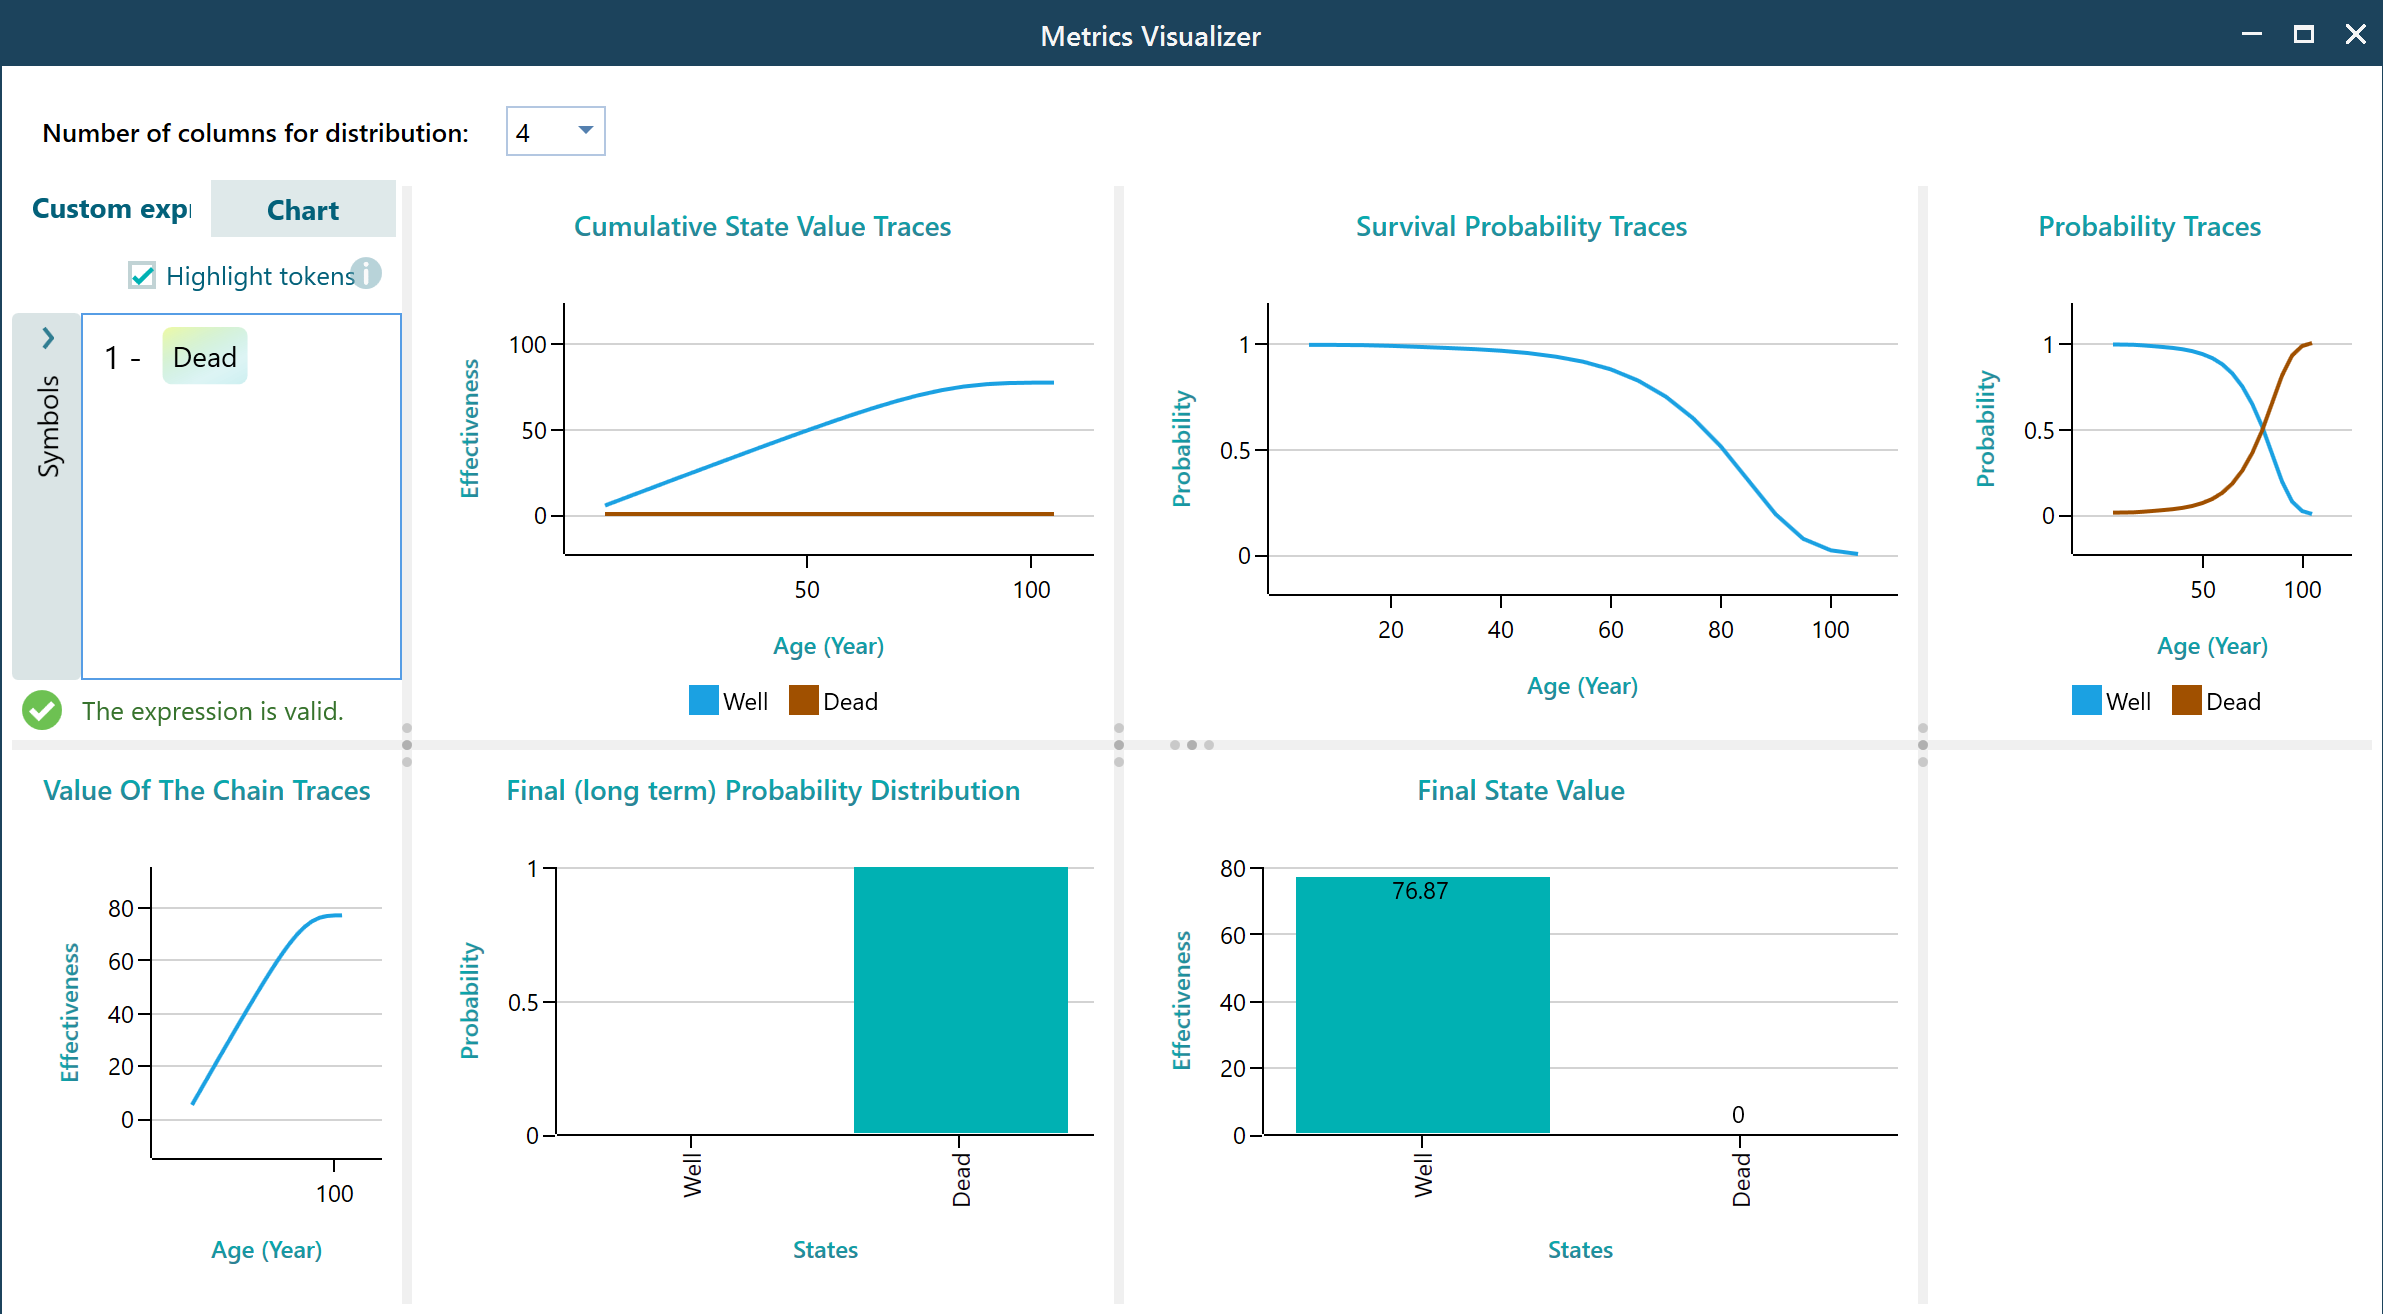
If you want to see the data table behind any chart, you can right-click on that chart and see the data table, which you can also export in Excel.
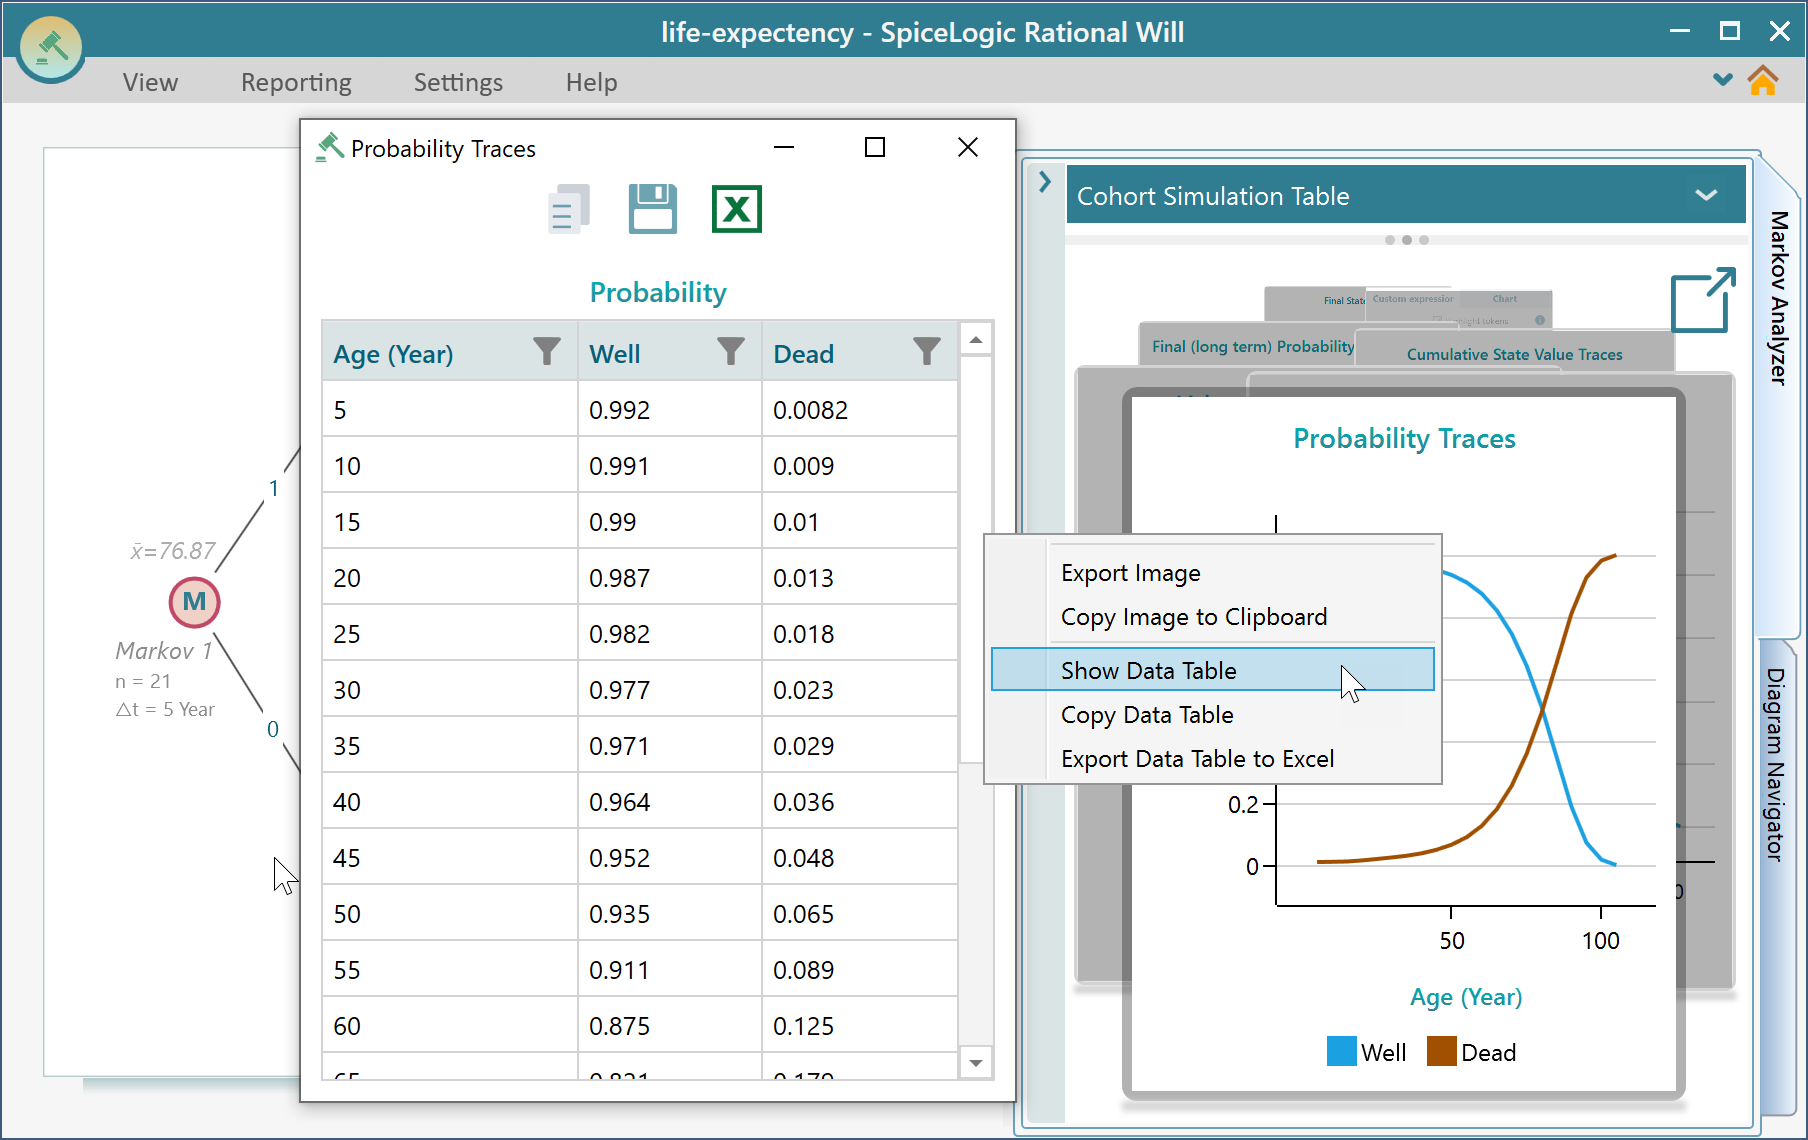
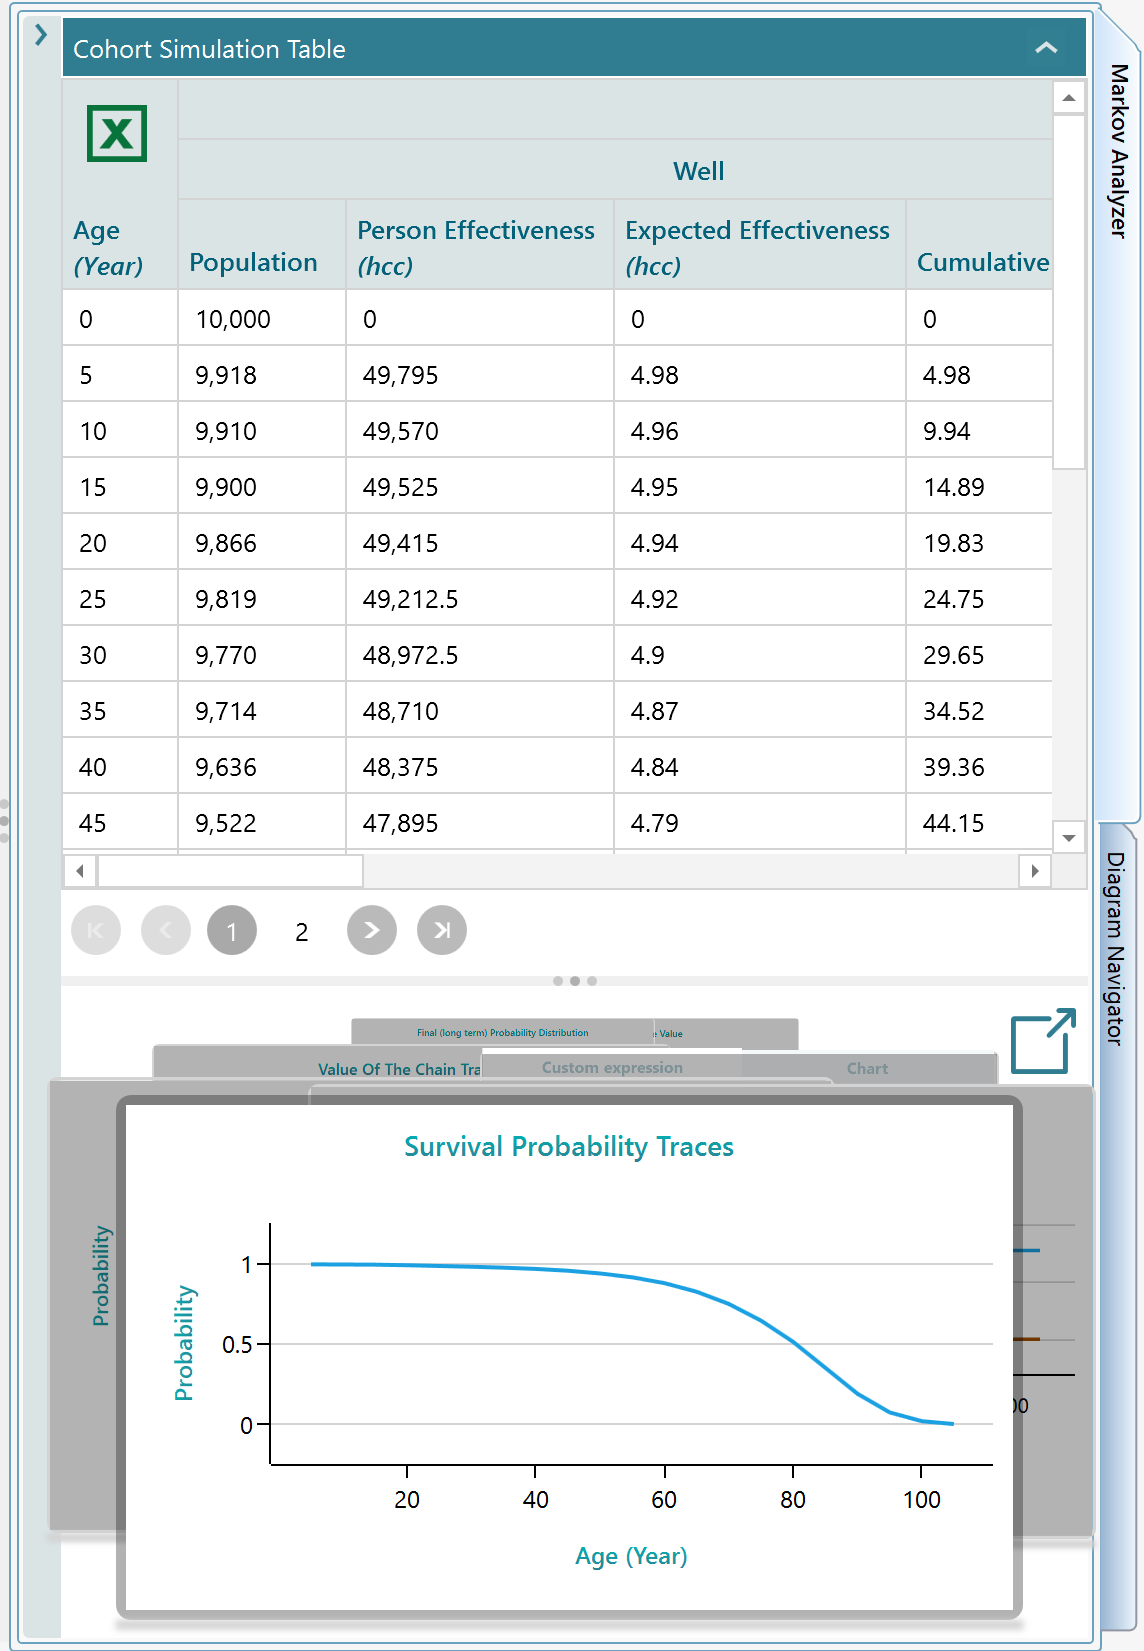
Also, you can get the organized Cohort simulation traces from this panel.
Step 7: Modifying / Refining the model
Once you have completed the wizard step-by-step user interface for creating your Markov model, you will see the decision tree showing the Markov Process Diagram. Now, you can change the States, Transition Probabilities, Rewards, anything or everything. Please learn how to work on the diagram for modification from this page.