Getting Started with the Bayesian Network
A Bayesian network (belief network) is a probabilistic graphical model that represents a set of random variables and their conditional dependencies via a directed acyclic graph (DAG). In the Rational Will or the Bayesian Network Software from SpiceLogic, you can easily create a Bayesian Network and query the network. You can instantiate a random variable upon observation of a state and the whole network is updated based on the evidence. Intuitive charts are presented to indicate the Root Cause Variables and Ultimate Symptoms variables.
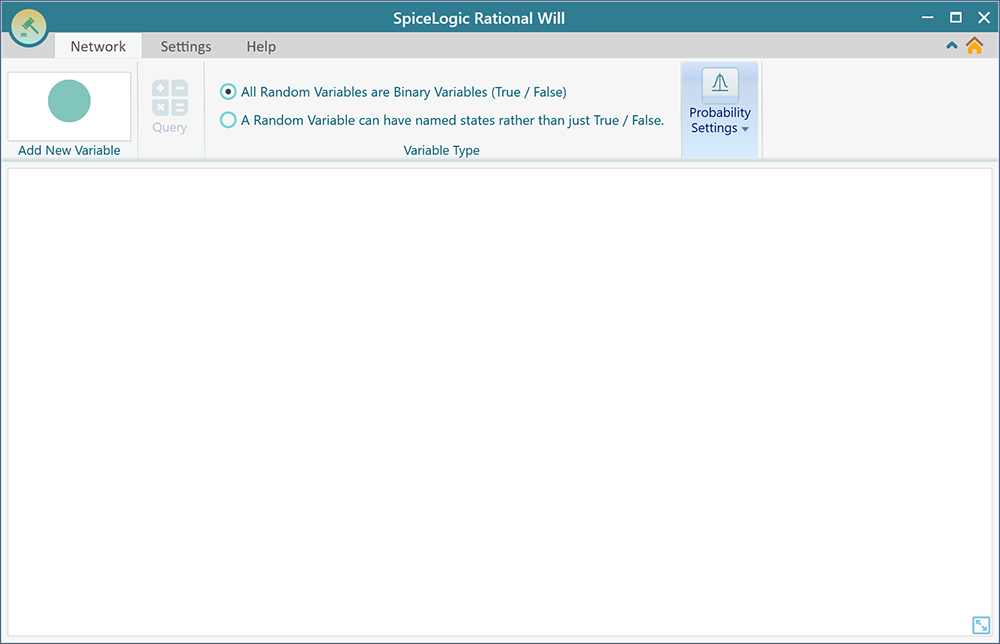
When you start the software, you are given options to choose "Bayesian Network" or "Bayesian Inference". If you have chosen a Bayesian Network, then you will see the following window.
Drawing a Diagram
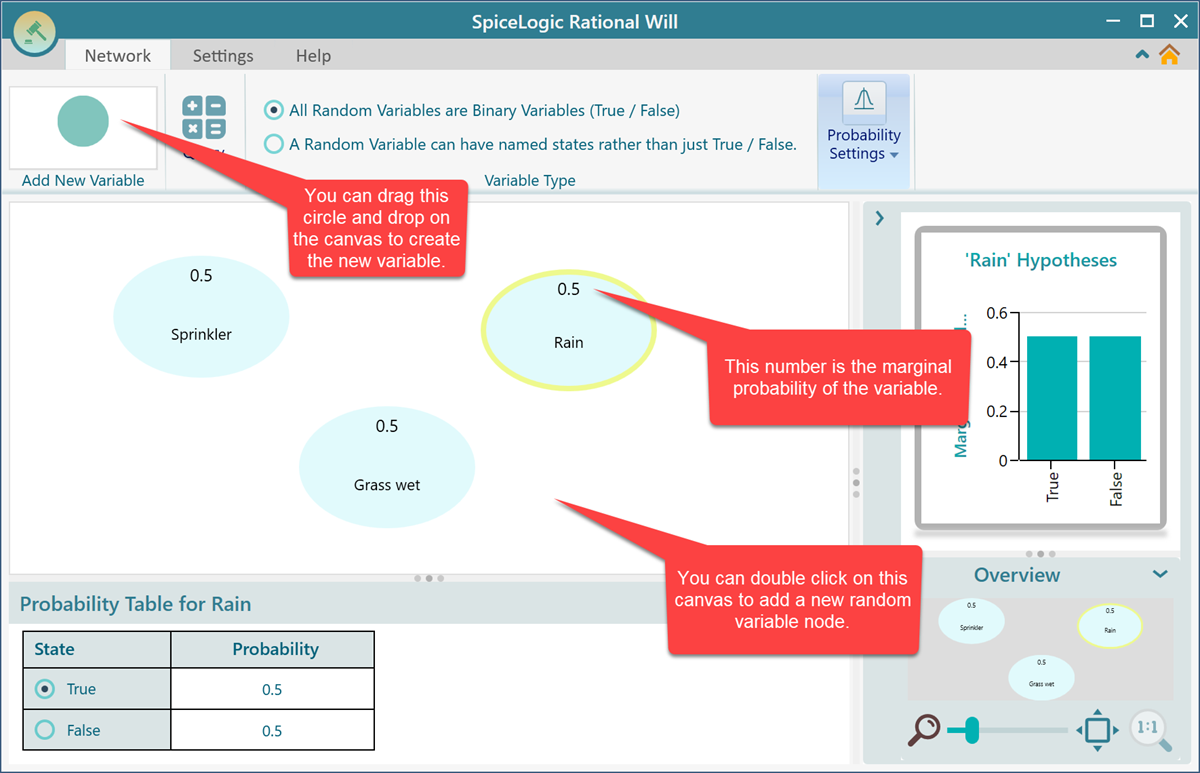
Bayesian Network tool is easy and simple enough that you can simply drag and drop a new variable node from the toolbar and connect the variables using arrows.
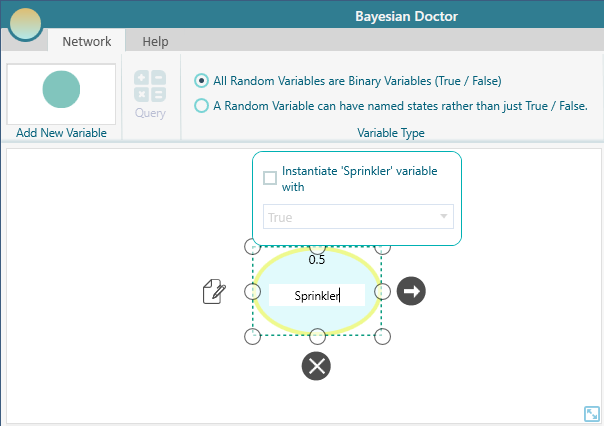
A node is added, you can double click on the node to edit the name of the variable.
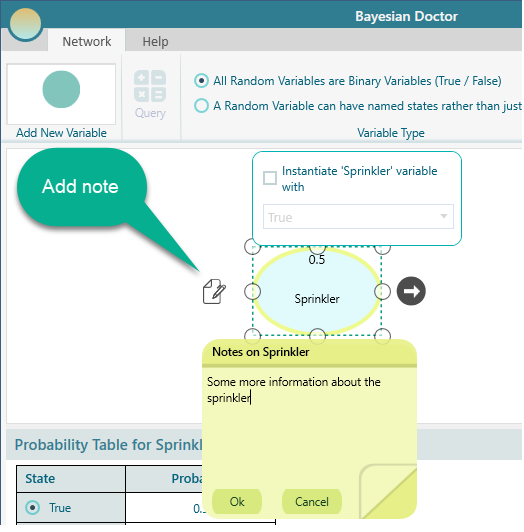
You can add a note for the node from the flyover menu.
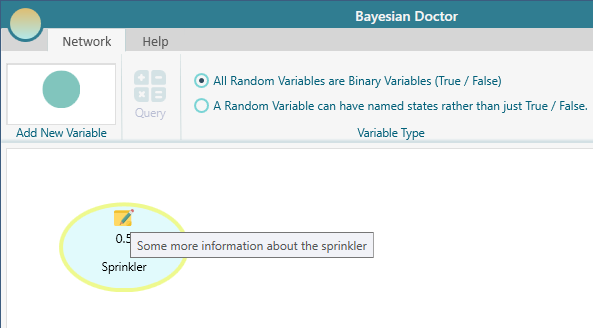
Once a note is added, it looks like this on the node.
Once the nodes are added, you can connect them to represent probabilistic relationships.
![]()
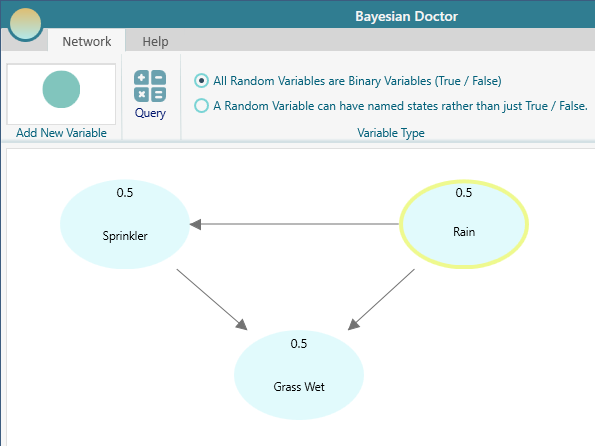
Finally, after connecting the arrows, the diagram will look like this:
Setting Probabilities
Now is the time to set probabilities.
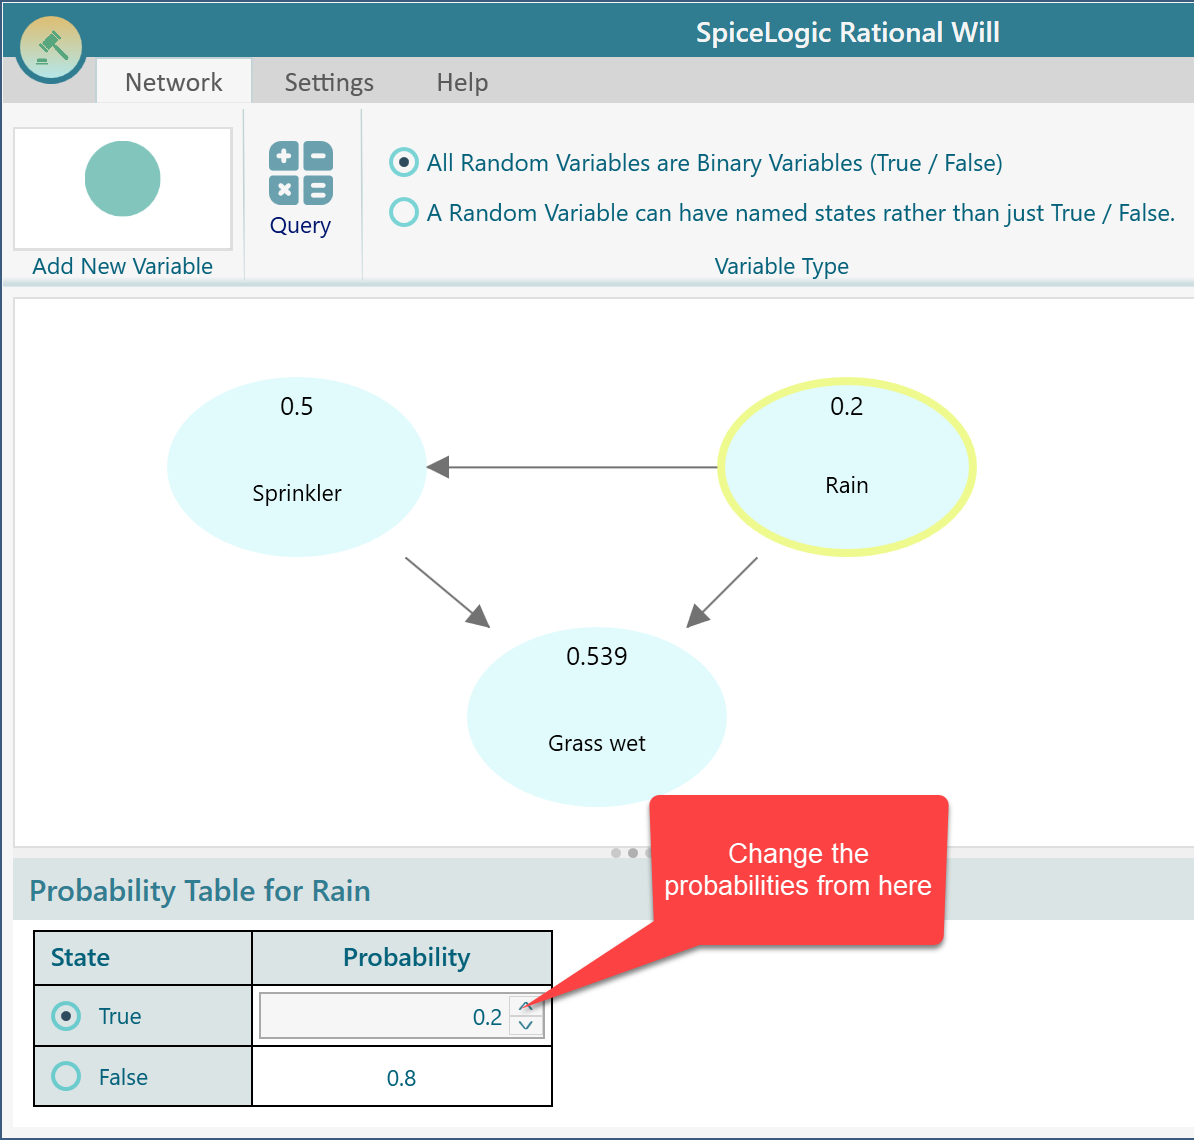
Once you select a Random Variable Node, the probability table shows up as shown here. Click on a cell to edit the probability. When there are just 2 states, the probability of the opposite state is auto-calculated. For example, when you change the probability of the 'True' state, the probability of the 'False' state is calculated as 1 - the 'true' state probability. Select the node "Rain" and set the probabilities as shown below.
As the variable "Rain" has no parent Node, the probability table shows only the states of the Rain variable. When a node has one or more parent node(s), a Conditional probability table is shown. Select the Sprinkler node and you will see the conditional probability table as shown below. Set the conditional probabilities for the 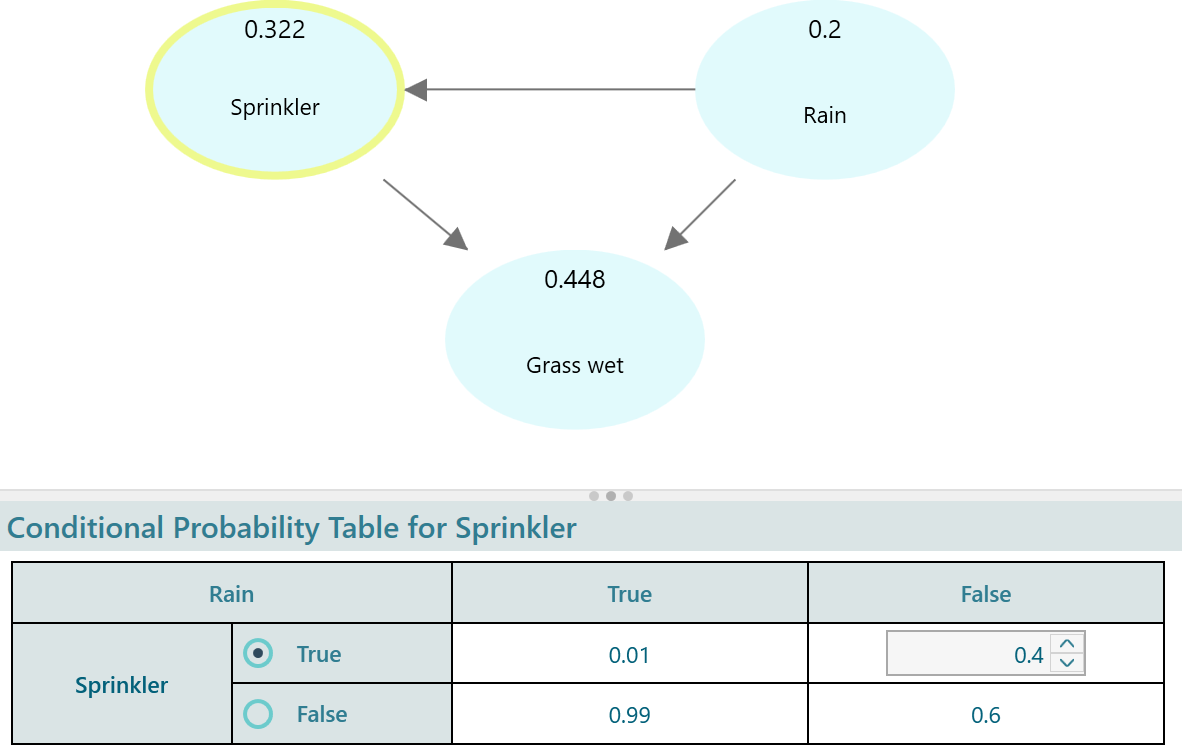 "Sprinkler" node.
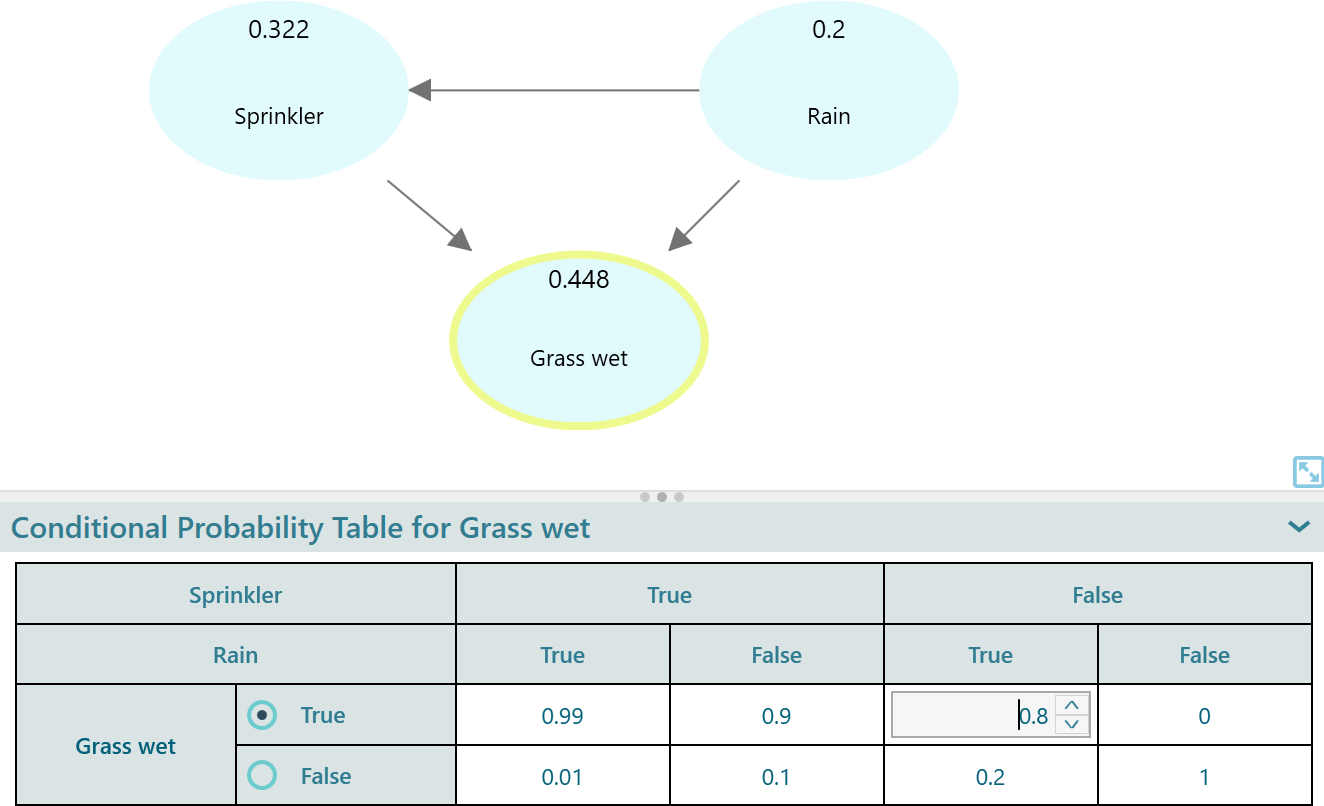
In the same way, set the conditional probabilities of the "Grass Wet" node by selecting that node and editing the numbers by double-clicking on them.
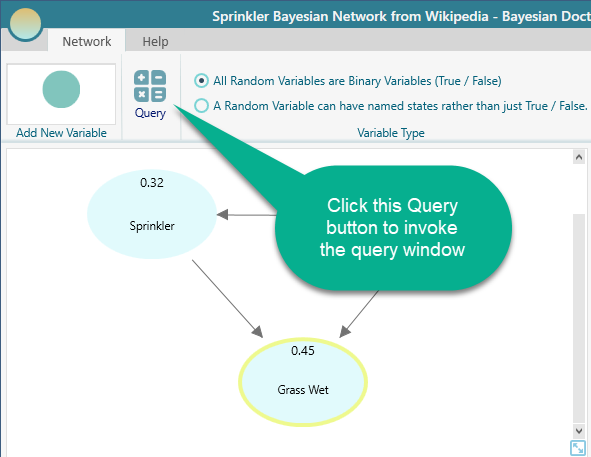
Query the Bayesian Network
Once you have completed the model for a Bayesian Network, you can query the network using the Query window. Click the Query Button from the toolbar and the query window will appear. You can calculate the joint probability, conditional probability, or joint with conditional probabilities, in any way you want.
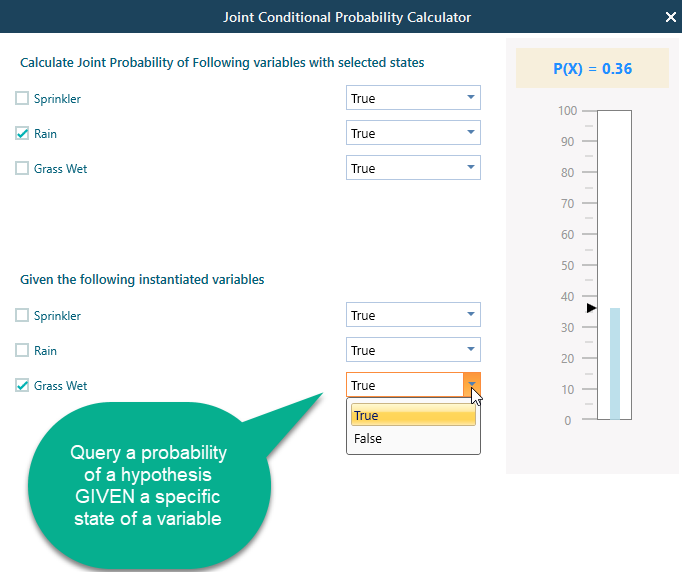
Find Conditional Probability
Say, you want to Query, what is the probability that Rain is true, GIVEN Grass Wet is True?
Find Joint Probability
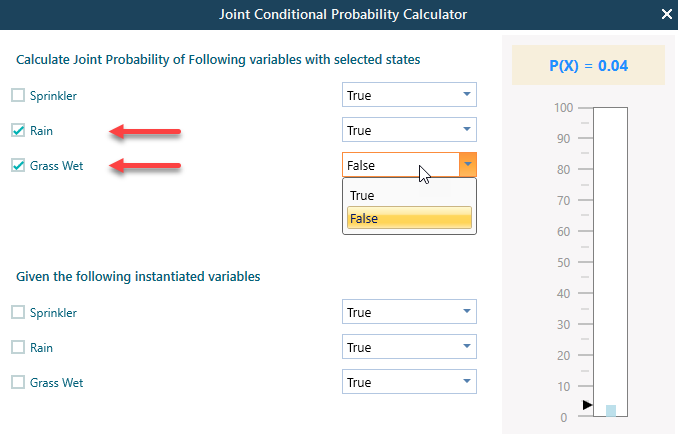
Say, you want to know, what is the probability that Rain is True AND Grass is Wet is False. You can find that as shown below.
Instantiate a variable upon evidence
When you get evidence for a variable state, (i.e. you observed the Grass is wet), then you can instantiate the Grass Wet variable with the True state as shown here.
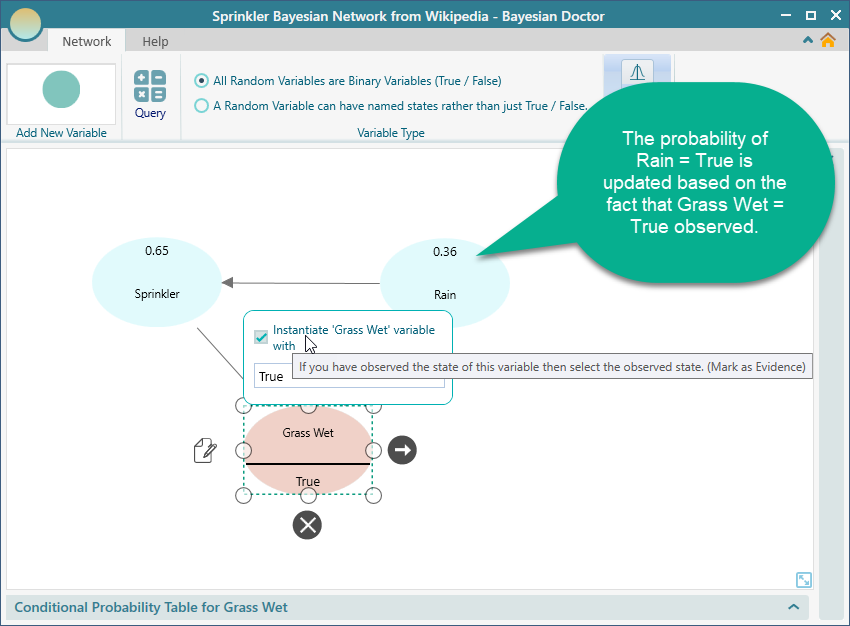
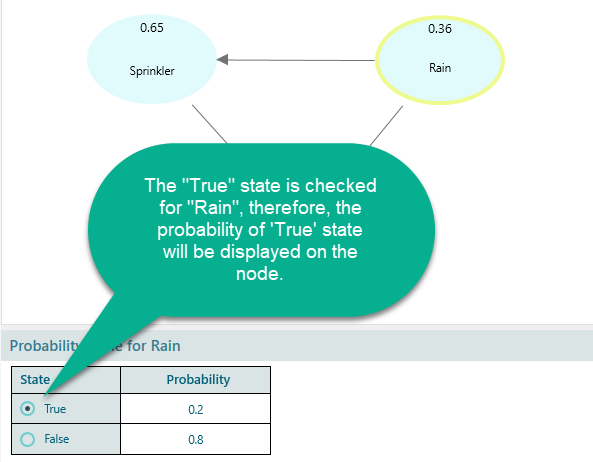
Notice that, when you instantiated the Grass Wet variable to True, the probability of Rain = True is automatically calculated and displayed in the "Rain" node. You can see that the Rain node is showing a probability of 0.36.
You may ask, how to define what state probability of the Rain variable will be displayed in the Node. You can set that from the Probability table. Notice the Radio button beside the state name. The checked radio button determines which state should be tracked in the node and in the chart.